 Patty Doran introduces a recent co-produced event which explored how different types of data can be used for good by the Voluntary, Community and Social Enterprise sector.
The event
The Voluntary, Community and Social Enterprise (VCSE) sector enriches British social and civic life in many, measurable ways. The VCSE sector encompasses a variety of organisations, from volunteer-based neighbourhood services to national charities and think tanks. Likewise, there is a range of data relevant to the VCSE sector available at three different levels which we explored during the event, and this data can be used for good.
With funding from the Economic and Social Research Council, on the 11th November 2020 Data for Good, a Festival of Social Science workshop, was co-produced by the UK Data Service and organisation from the VCSE sector to, firstly, promote the use of data in the VCSE sector, and secondly, to showcase the diverse variety of data use within the sector.
The workshop introduced methods for accessing and using data across three levels. We defined service, sectoral and societal data as follows:
- Service level data comes from VCSE organisations. Data includes demographics, information about service users’ needs and the uptake of service provision.
- Sectoral data is about VCSE organisations. Data includes where funding is coming from and who it is going to, the development of new organisations and current gaps in the sector.
- Societal data provides the national context; representative data about trends, attitudes and change.
Service level data
Demonstrating the impact of VCSE services and quantifying the value of the sector is an important task. Data generated through service provision is a good place to start to build an evidence base. Service level data can be split into two types: routine and specific.
Routine data can be thought of as everyday data and includes: demographics; numbers of service users; processes of the service – courses run, attendance, etc; costs of service elements; needs of service users.
Other data might be linked to specific service goals. This specific data might include: effectiveness measures, such as outcome success rates; quality measures, such as user ratings of services or satisfaction surveys; efficiency measures, such as did not attend (DNA) rates.
Service data can tell us about the outcomes and impact of the service. Some basic analysis can show: What is working? Who it works for? How it works and how much success costs.
Service data making a difference
At the workshop, Mark Wynn from HMR Circle talked about how they have used data generated by their service to gain international recognition for the work they do to reduce social isolation amongst older people in their community. Circle have worked with a mix of external researchers to evaluate the work that they do, to find areas for improvement, identify good practice and create evidence showing that what they do really works. In recent years they have worked with the Q-Step programme at Manchester Metropolitan University and benefitted from paid summer interns. As a result of the research, recommendations and suggestions have been implemented to improve the experience of the older people Circle work with. Research evidence has also been used as the basis for successful funding applications.
Hanif Bobat shared the experiences of the Ethnic Health Forum where they have started collecting basic demographic and service use information. The collected data has demonstrated service needs and led to increased recognition of the value of their service. For example, the Ethnic Health Forum has recently been awarded an Awards for All grant from the National Lottery, an achievement Hanif links directly their ability to provide the data and evidence of their service use. In turn, the funding boost allows the Ethnic Health Forum to increase their service delivery.
Sectoral data
Thanks to the dedicated (and often unrecognised) work of regulators, funders, infrastructure bodies and others, there is now an abundance of data available on the VCSE sector in Britain. We term this sectoral data as it describes the shape and activities of the VCSE sector at an aggregate level.
For example, Charity Commission for England and Wales’ data resources provide the foundation for learning about the make-up of more than 160,000 registered charities operating in this jurisdiction. A much welcomed recent development was the establishment of 360Giving, a charity that has worked extensively with UK funders to make the grants data they hold more open and standardised. This sectoral data helps organisations understand the range or organisations in the sector, and where the funding is going. For example, with this information organisations can identify gaps in service provision and understand the types of services that have successfully received funding.
Sectoral data making a difference
At the Data for Good workshop, Victoria Boelman from The Young Foundation shared their development of an Index of Community Strength – a metric they developed to understand differences in community activity across the country. They used sectoral data to create a combined funding index, which they compared to area deprivation (see image), to create an index of community resilience and strength.
The findings of their analysis generated significant interest among third sector organisations working to strengthen communities, and within government departments including Ministry of Housing, Communities and Local Government (MHCLG). The Index is also being used to inform decisions about other work undertaken by The Young Foundation. You can access an interactive 3D visualisation of the Index of Community Strength on their website.
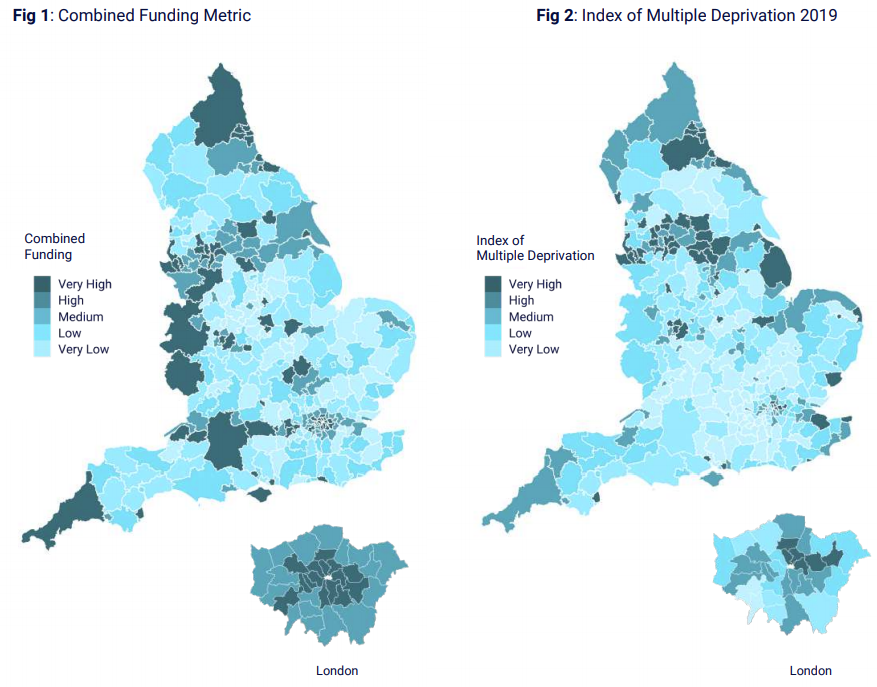
Image: figures showing map of England and Wales. Figure 1 depicts the Combined Funding Metric and figure 2 shows the Index of Multiple Deprivation, with scales on both ranging from very low to very high.
The original version of these figures can be found on page 6 of the Young Foundation’s 2019 report Flipping the Coin: The two sides of Community Wealth in England.
Societal data
Thousands of people across the nations of the United Kingdom are interviewed every day; they are asked about their lives and what they really think about important social issues. The social survey data produced through these interviews creates an extremely valuable resource of societal data. Much of this data is held by the UK Data Service.
Societal data gives important context to the work in the VCSE sector. What inequalities are experienced across the nation? What are the health, wellbeing and economic needs of your target audience? Secondary analysis of key survey data can answer these questions and more. For researchers in the VCSE sector, the data is free to access from the UK Data Service.
Many VCSE organisations are small, often there is no dedicated research team; it may fall to the people delivering the services to also provide the evidence of need and impact. Conducting secondary data analysis presents many advantages in relation to size, quality and accessibility of data. Although analysis of some of the large datasets can be complex, there are also accessible online tools for exploring societal data and quickly providing context to the area you work in.
Societal data making a difference
As an example of societal data use, Thomas Watson from Independent Age discussed their work highlighting inequalities within the experiences of older people across the UK. Working with external research partners they combined findings from in-depth qualitative interviews with quantitative analysis of Understanding Society; a study that explores social and economic change in the UK. The combination of data presented in their report explores the different challenges facing sub groups of older people in England today. The findings have informed their policy consultation responses to government and other high level decision making bodies, most recently in a relation to the needs of older people during the COVID-19 pandemic.
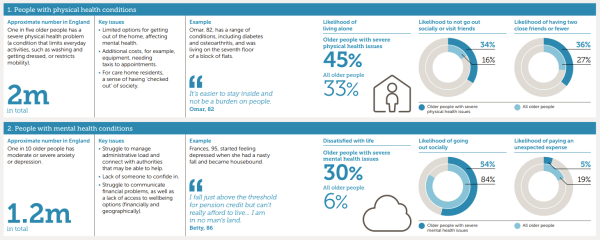
Image: part of an infographic presenting data on the effects of physical and mental health issues on older people.
The original infographic is on page 8 of Independent age’s report In Focus: Experiences of older age in England.
Conclusions
‘In all these things It can come across as slightly academic, the use of the words like data. But in reality, we’re translating that data into real life positive human benefits. We affect the lives of the people we work with on a positive level, by analysing the stuff we do. It is not an academic exercise, although it is academia, it produces real working benefit to the people that we support. That’s the beauty of it. It is not just number crunching there is a real positive outcome to the what we do.’
Mark Wynn, HMR Circle
The Festival of Social Science Data for Good workshop represented one event in a programme of training and support from the UK Data Service developed specifically with and for the VCSE sector. In July a series of online workshops were delivered introducing Social Data and the Third Sector: evidence, skills and tools. And currently in development is a data guide specific to using data for impact in the VCSE sector.
It is worth repeating that the VCSE sector enriches and improves life in Britain in many, measurable ways. There is an increasing amount of accessible data available for social scientists and researchers from the VCSE sector to use at the societal, sectoral and service level – and this data can be used for good.
The Data for Good Festival of Social Science Workshop was co-produced. I would like to thank and acknowledge the input from: Diarmuid McDonnell, UK Data Service, University of Manchester and Third Sector Research Centre, University of Birmingham; Susanne Martikke, Greater Manchester Centre for Voluntary Organisation; Lucy Webb, Manchester Metropolitan University; Lucy North, Greater Manchester Centre for Voluntary Organisation; Victoria Boelman, Young Foundation; Mark Wynn, HMR Circle; Hanif Bobat, Ethnic Health Forum; Thomas Wilson, Independent Age.
About the author
Patty Doran (@Patty_NZ) is a Research Associate for the UK Data Service based in the Cathie Marsh Institute for Social Research at the University of Manchester. Patty’s research has focussed on ageing, inequalities, social support and the life course, and using mixed methods to address complex research questions.