 In part one of this blog series looking at the travel to work data from the 2021 Census, Dr Oliver Duke-Williams, the UK Data Service Director for Census, looked at some of the interesting findings in the data. In this second and final part, he looks at what the future might hold, and discusses the impact of the Scottish census taking place in 2022, and how we can use this offset as a natural experiment.
What might the future hold?
Ordinarily, the second most common mode of travel is about what people use other than driving cars, and can be useful for considering the potential and practicality of schemes to reduce car usage. This is complicated in the 2021 results by co-dominance of working from home. We could ask the question of how long lasting this apparent switch to working from home will be? Is it a pandemic response that will revert to previous levels over time, or does it represent a paradigmatic shift? It’s useful to remember the context.
At the time the country was in under pandemic restrictions, and many were working from home in a way that they had not done before. Yet at the same time, it is also possible that there was a preference for driving (amongst those with the option to do so) due to concerns about the safety (risk of exposure to Covid) of public transport. Public transport usage patterns may have changed, but use of masks and other mitigations have become much less common – a ‘fear of public transport’ narrative does not seem convincing for explaining current 2022 patterns of usage.
Are we seeing a genuine shift to working from home? Anecdotally, it would seem that this might be the case – many people are working at least part of the time from home. Yet it should be remembered that this is only an option for a limited set of people: some employers tackle more presenteeist approaches, and many occupations simply cannot be done from home.
This raises a question of how we might be able to tell whether this is a long-term shift. The census may not be the best instrument to explore this issue. A census, by its nature, asks a limited set of questions, often with a limited and fixed set of response categories. Typical forms only contain space to enter one set of details for an employer – it does not adapt well to record the circumstances of people with more than one job, especially if it is difficult to say which is the ‘main’ job. Similarly, only one transport mode can be entered.
The background to census limitations is that we may see a shift in whole or part away from traditional censuses and towards the use of admin data. However, the journey to work is a good example of a census theme that it is difficult to replicate in admin data. Even if there were good, consistent data about a person’s home, workplace, and employer), we would still be very unlikely to have any information about the mode of travel. Many people have expressed interest in the potential for use of mobile phone location data for observing people’s movement although some very significant hurdles would need to be overcome.
Effects of moving the census in Scotland
The postponement of the census in Scotland has also led to some unusual effects on the data.
Persons who travel to a workplace in Scotland from a residence in England, Wales or Northern Ireland will have been recorded in the census in 2021. Persons living in Scotland and working in England (or elsewhere in the UK) will have been recorded in the 2022 Census in Scotland. This temporal offset makes it impossible to produce simple UK level results.
This is also true of aggregate data: we can’t produce a comprehensive UK data set representing a fixed point in time – we would either have to model the Scottish results backwards, to produce estimates of the equivalent counts in 2021, or model forward the results in the rest of the UK to produce 2022 estimates.
Of course, this is quite possible – producing mid-year population estimates is part of statistical agencies’ normal work. The difference here is that we are looking at larger volumes of data with a wide variety of attributes, and furthermore that we would be modelling (whether forward or back) through a very volatile period. Here, we can return to the idea of commuting and migration flows – these were very strongly affected by the volatility of 2020-2022, and thus making estimates is difficult.
As with origin-destination data, unusual effects can occur in the aggregate data observations that are used as denominators in calculating flow rates. Someone who moved from England to Scotland between April 2021 and March 2022 would be recorded in both the 2021 Census in England and Wales, and the 2022 Census in Scotland. Their counterpart moving the opposite way would be recorded in neither.
How many people might be affected by this? It is hard to say, as the pandemic led to changes in work, and also to changes in where people were living. A constraint was that the housing market was not operating at its full capacity for parts of lockdown, and the markets in England and Wales and in Scotland operate under different regulatory environments.
However, the 2011 Special Workplace Statistics (SWS) and Special Migration Statistics (SMS) allow us to look at what was happening a decade ago. Both datasets are available through the UK Data Service (https://wicid.ukdataservice.ac.uk/)
Using the SMS, we can look at migration flows from specific origins to specific destinations. Grouping together by country, we find that in the year prior to the 2011 Census, 40,975 people moved to Scotland from the rest of the UK, and 42,554 moved from Scotland to the rest of the UK (these compare to around 490,000 moving within Scotland).
The totals in each direction are not hugely different, but it remains the case that the effects are opposite: those moving to Scotland would appear twice, and those moving from Scotland would not appear at all. However we can distinguish here between individuals, and their contribution to an aggregate total.
Figure 1 shows hypothetical flows between Scotland and the rest of the UK. Flows are indicated by arrows, and those arrows that are shaded grey are captured in the relevant census. The arrow marked ‘a’ represents those people moving from the rest of UK to Scotland in 2021-22 and (if they completed the form) captured in both censuses. The arrow marked ‘b’ represents those moving in the opposite direction and captured in neither. Does Scotland’s population show a false gain, through arrow ‘a’? No, because the ‘b’ flow has still taken place – people have left Scotland – and whilst they are not captured as individuals, their removal from the aggregate observation for Scotland has still occurred. Similarly, those in arrow ‘c’, who moved to Scotland in the year 2020-21 are not recorded (as migrants), but the change to aggregate stocks is still apparent.
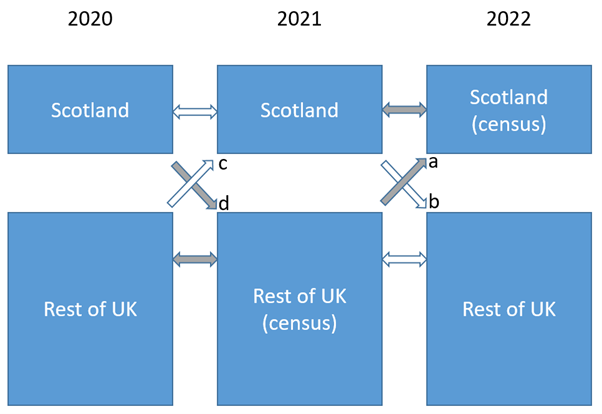
Figure 1 – Flow components for migration between Scotland and the Rest of the UK 2020-21 and 2021-22
Does it matter at the individual level?
Of course, we would like all individuals to be reflected correctly in the data. In ‘normal’ times, we might assume that migrants have broadly similar characteristics: those who moved to Scotland in 2021-22 (arrow ‘a’) were similar to those who moved to Scotland in 2020-21 (arrow ‘c’), and so on. If this were the case, then we might think that the situation is not too bad – the similar sizes of flows means that stocks are not strongly affected, and the similarity of characteristics would that our aggregate observations would be consistent.
However, it is clear that we cannot assume similarity in characteristics of those moving at different stages in the pandemic. Some people remained in work (and those with jobs that could be conducted remotely may have had a broader choice in relocation destinations), whilst others were out of work or furloughed. Variations in the regulation of housing markets in both Scotland and in the rest of the UK will have affected the feasibility of moves, both for owner occupiers and for those renting.
We can also look at the SWS to examine flows of commuters across the border. In the 2011 Census there were around 29,000 people travelling for work from the rest of UK to Scotland, and 17,000 travelling from Scotland to the rest of the UK. This is perhaps more interesting than the migration data, given the bigger imbalance in the numbers.
Figure 2 shows the pattern of cross-border commuting balances, using data from 2011. Unsurprisingly, the areas strongly affected are generally close to the border. For Scotland, we see gains in the central belt (that is, there were a larger number of people living in England and working in Edinburgh and Glasgow etc., than living in those locations and working in England). Elsewhere in Scotland we see a net loss of commuters in the Scottish Borders and Dumfries and Galloway areas.
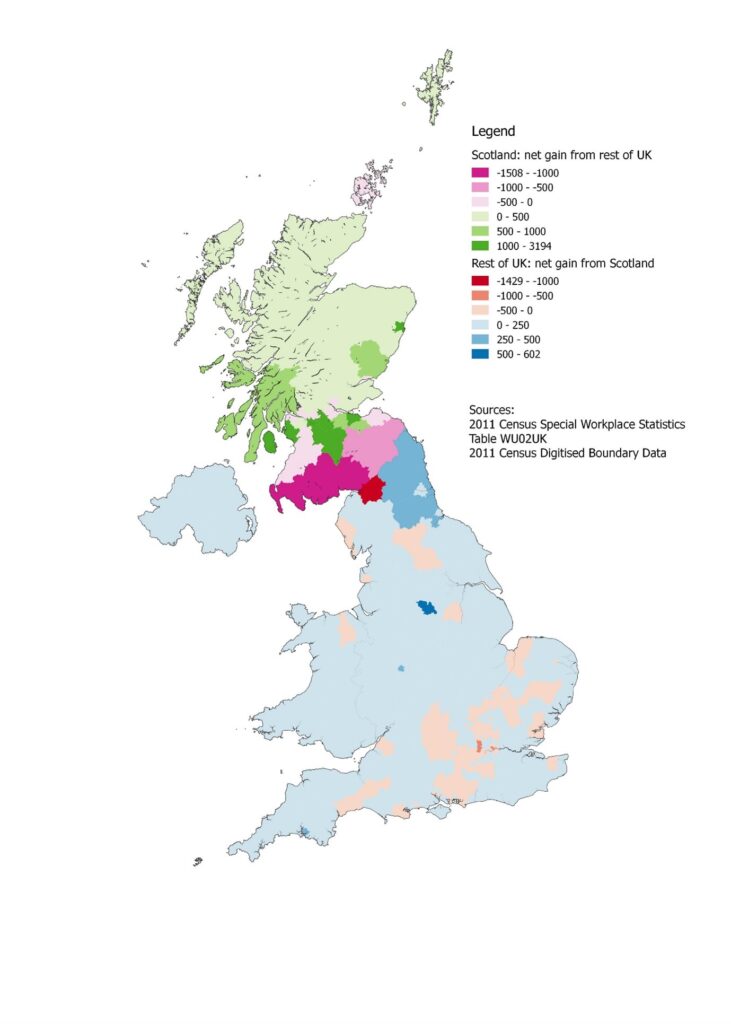
Figure 2 – Net balance of journey to work data between Scotland and the Rest of the UK
Across England, we generally see small net balance, with stronger gains in Northumberland and County Durham. A notable gain is seen in Sheffield, and there are sporadic net losses in some parts of England – this perhaps reflecting weekly commuting patterns rather than daily ones.
Looking to the future
What then should we make of the delay in the census in Scotland?
Analysis of data from 2011 can only take us so far, as we know that this is unlikely to be greatly indicative of the movements taking place in the period 2020 to 2022. Comparisons that may be more interesting will be to look at the levels of working from home as reported in 2022 in Scotland.
According to the political narrative that we are now ‘post-pandemic’, Scotland has had an extra year for a potential return to ‘normality’. How many people in Scotland who might have said in 2021 that they were working from home had ‘returned to the office’ by the census in 2022? What are the patterns that we will see in this?
The 2021/22 journey to work data will help is to understand this process, both in Scotland and elsewhere. The migration data will help us to look at the characteristics of those moving (to and within Scotland) in 2021-22, and to compare them to those moving – albeit to different destinations – in 2020-21.
We will await these data with interest.
About the Author
Oliver Duke-Williams is an Associate Professor in Digital Information Studies at the UCL Department of Information Studies, and is deputy director of the Digital Humanities masters programmes there. He is also Census Service Director at the UK Data Service, and a senior advisor in the Centre for Longitudinal Study Information and User Support (CeLSIUS).