 In part one of this two-part blog looking at the travel to work data from the 2021 Census, Dr Oliver Duke-Williams, the UK Data Service Director for Census, looks at some of the interesting findings in the data on journeys to work.
Background
Census agencies are now in the process of releasing the results of the 2021 Census, and data on several themes have been released. One of the most interesting has been a set of univariate observations of the labour market and the journey to work. These are particularly interesting in the 2021 Census, as they refer to elements of everyday life that were particularly affected by the Covid-19 pandemic.
In the UK, we have three censuses – one conducted by ONS in England and Wales, one conducted by NISRA in Northern Ireland and one conducted by NRS in Scotland – these generally feature very similar question sets, and have been conducted on the same date. The census in Scotland was moved to 2022 due to the pandemic, but the censuses in England and Wales and in Northern Ireland were conducted in 2021. This has introduced difficulties in doing UK-wide analysis for all observations and, as we will discuss in part two of this blog, has some specific issues when it comes to journeys to work.
This blog reports on journey to work data as released for England and Wales by ONS in December 2022. These data are available from ONS and from the UK Data Service.
The census asked a number of questions about work, including whether the person had worked in the last seven days, what their employment status was, number of hours worked, job title and activities, and details of the employer etc. Questions were also asked about the person’s place of work and the transport mode used to travel to work. As in previous censuses, people filling in the form were told to state the method used for the longest part of the journey by distance.
The census date (March 21, 2021) occurred during the pandemic, and thus many peoples’ work was affected. This date was during a phase when a ‘stay at home’ order was in force. The census aimed to gather data about what people were doing at that time, rather than what they may have been doing had the pandemic not occurred. Had the timing been different (for example, if the census had been conducted in March 2020) then speculatively it may have been reasonable to ask someone what they would ‘normally’ be doing, however a year into the pandemic that approach was not possible. The effects of the pandemic were reflected in the question guidance, which stated:
“If you have a job but have been off work because you have been furloughed, in quarantine or in self-isolation, select ‘Temporarily away from work ill, on holiday or temporarily laid off’.”
The data released in December 2021 are aggregated on the basis of residence: they show results for all persons living in each area. More detailed data based on the matrix of all residences to all workplaces – known as the Special Workplace Statistics – will be released later in 2023.
Journey to work results
The journey to work results are notable in that (unsurprisingly) they show a very large number of people to be ‘working at or mainly from home’. The headline data showed that in the week leading up to the census, over 31% of people in England and Wales, aged over 16, and in employment, were working at or from home; this compares with around 5% in 2011. Table 1 shows the total observations for England and Wales for all modes.
Table 1 Mode of travel to work, Census 2021, England and Wales
| Method used to travel to workplace | Observation | % of all persons | % of persons in employment | % of persons in employment (excluding WFH) |
| Work mainly at or from home | 8,671,722 | 15% | 31% | n/a |
| Underground, metro, light rail, tram | 505,311 | 1% | 2% | 3% |
| Train | 529,461 | 1% | 2% | 3% |
| Bus, minibus or coach | 1,160,990 | 2% | 4% | 6% |
| Taxi | 200,490 | 0% | 1% | 1% |
| Motorcycle, scooter or moped | 128,849 | 0% | 0% | 1% |
| Driving a car or van | 12,524,571 | 21% | 45% | 66% |
| Passenger in a car or van | 1,083,447 | 2% | 4% | 6% |
| Bicycle | 569,295 | 1% | 2% | 3% |
| On foot | 2,113,657 | 4% | 8% | 11% |
| Other method of travel to work | 285,873 | 0% | 1% | 1% |
| Not in employment or aged 15 years and under | 31,823,877 | 53% | n/a | n/a |
One approach to looking at this data is to ask what the most common mode of travel to work was, for each area. As noted above, this is aggregated on the basis of where people live, rather than where they work. The most common mode does not necessarily mean that ‘most’ people (that is, at least 50% of those involved) used that method, simply that it accounted for the largest share.
Figure 1 shows the most common mode when observed at LSOA level (the scale we select will affect how much variation we see in the results). The split is almost entirely between driving and working at or from home. As described above, it should be recalled that this was observed during the pandemic, and that many people had lost jobs or were furloughed, and many people were unable to travel to their usual workplace.
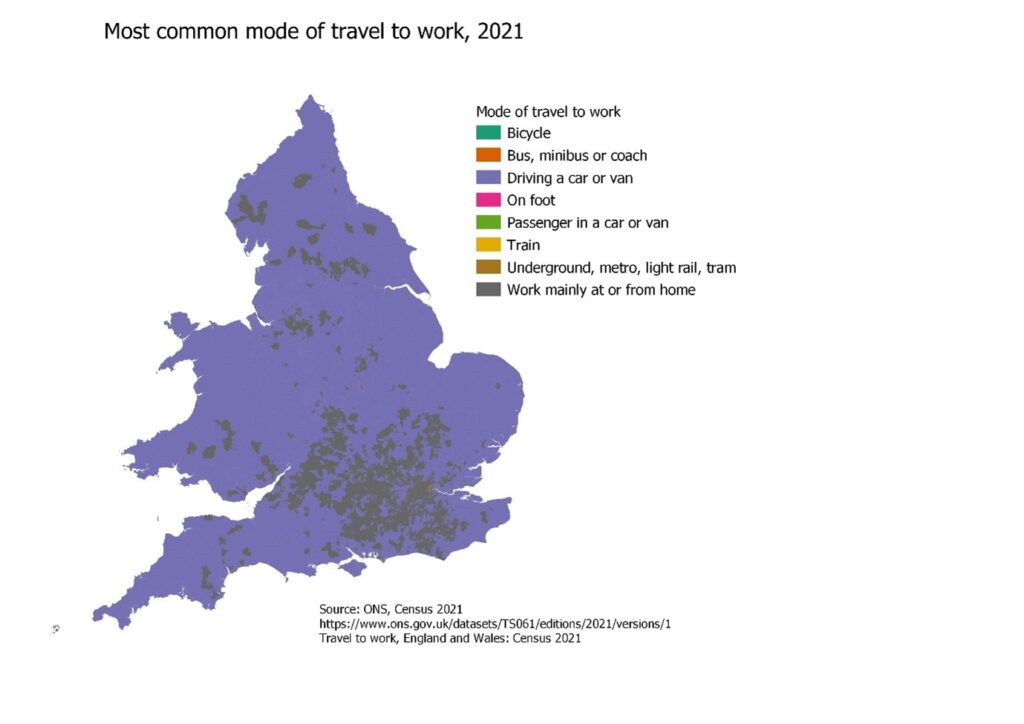
Figure 1 – Most common mode of travel to work, 2021 (LSOA level)
It is also often interesting to look at the second most common mode of travel to work (or the second highest observation of any skewed variable). This is shown in Figure 2. To a large extent this is the ‘negative’ of Figure 1 – for areas where the most common mode was driving a car or van, then the second most common mode was working at or from home, and vice versa. However, that is not universally true, and we can also see many areas dotted around the country where ‘on foot’ was the second more common mode, and we can see a fringe of underground usage around London.
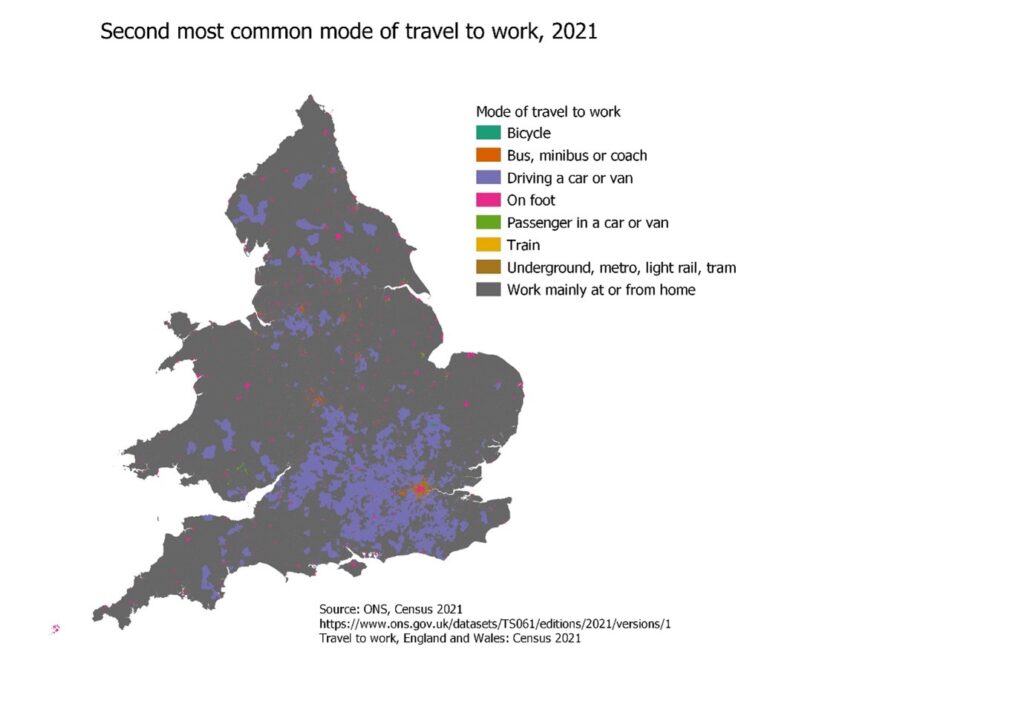
Figure 2 Second most common mode of travel to work, 2021 (LSOA level)
As we have seen, the 2021 results were dominated by those working from home. What are the patterns if we ignore this category? Figure 3 shows the most common mode of travel excluding all people who were working at or from home. The results are stark: the map is almost entirely dominated by driving. As we look closer, we can seem some use of other categories. As explained above, this does not mean that all people were driving to work, but rather that of all modes, driving was the most common (once working from home was excluded). It should also be remembered that we are only looking at those who were in employment, and those who were furloughed from their job were instructed in the guidance to say that they were away from work.
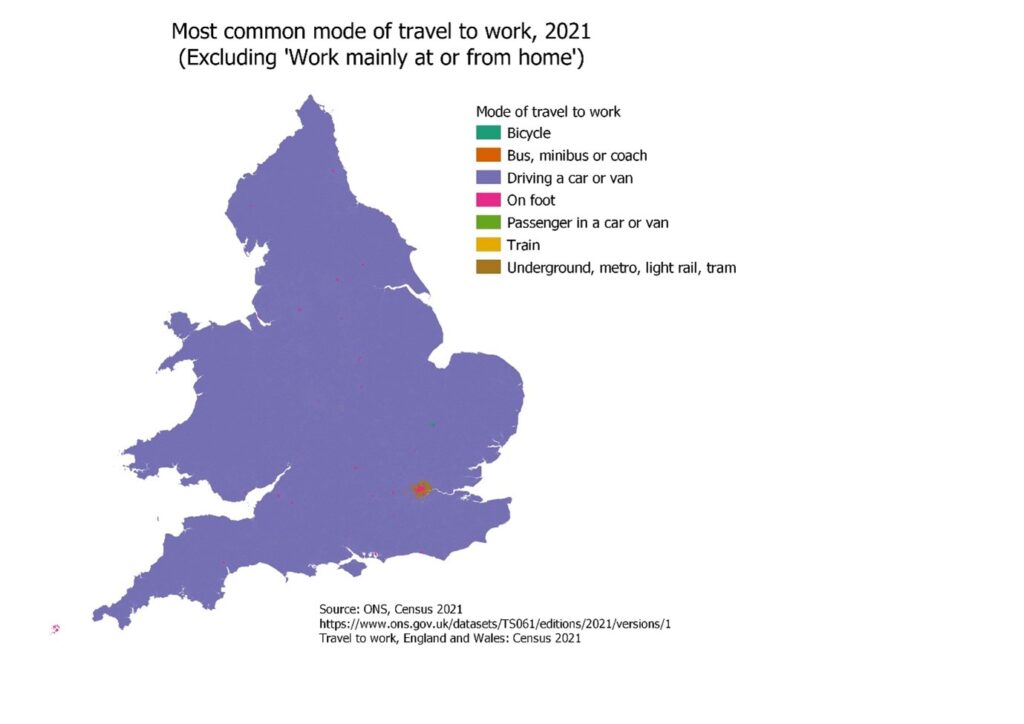
Figure 3 – Most common mode of travel to work, 2021 (excluding WFH)
We see far more interesting detail in Figure 4. This shows the second most common mode of travel to work (similarly to Figure 2), but having excluded working from home. The most common mode (Figure 3) was invariably driving, so Figure 4 effectively shows us the pattern once both driving and working from home have been removed. We can see that ‘on foot’ is a very common mode across the country, as is being a passenger in a car. The transport geography of London emerges in the map, with train usage common in the south of the city, and underground usage common in the north. Clusters of bus usage can be seen in a number of cities.
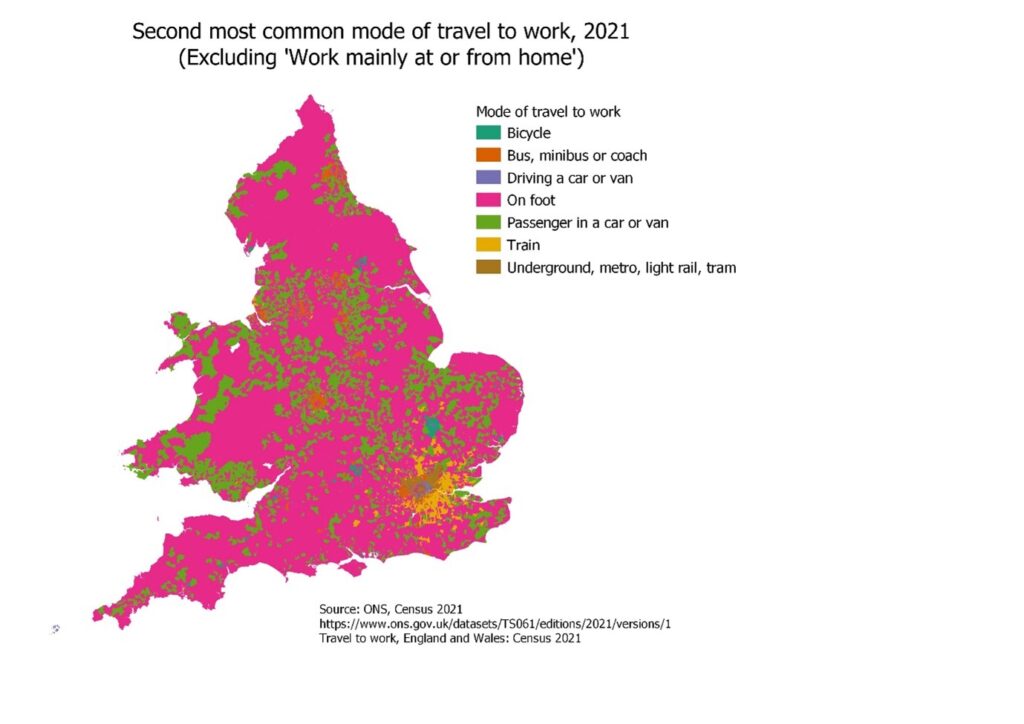
Figure 4 Second most common mode of travel to work (excluding WFH), 2021, LSOA level
The patterns that we see are dictated to some extent by the geography that we use. Were we to look at a national level then only one mode would be shown; as we move towards smaller areas, we see more variation. Figure 5 repeats the analysis above in London, using Output Area level data, the most spatially detailed that we have available; the left hand map shows the most common mode (the equivalent of Figure 1 above, whilst the right hand map shows the second most common mode, once we exclude working at or from home.
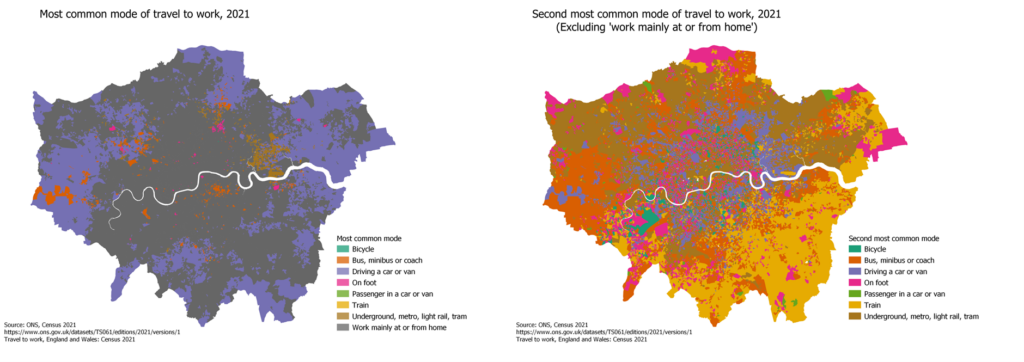
Figure 5 – (left) Most common mode of travel to work, 2021; (right) Second most common mode of travel to work excluding working at or from home), 2021
It is worth noting that the methods used can break down at OA level. The largest and second largest observations are identified for each area. For larger areas (such as LSOAs) the numbers involved are high enough that there is usually a distinct candidate for each rank. However, at OA level, the numbers of people are much lower, and thus it can be the case that there are two modes that have exactly the same count (typically for the second most common observation). When this was the case, the methods employed would mean that the first category with that value would be selected, using the order of modes as shown in Table 1. Thus, if ‘bicycle’ and ‘bus’ had the same value, bus would always by selected, as the earlier listed mode.
In Part 2 I will look at what the future might hold for travelling to work, and also look at how the Scottish census taking place in 2022 will impact UK-wide results.
About the Author
Oliver Duke-Williams is an Associate Professor in Digital Information Studies at the UCL Department of Information Studies, and is deputy director of the Digital Humanities masters programmes there. He is also Census Service Director at the UK Data Service, and a senior advisor in the Centre for Longitudinal Study Information and User Support (CeLSIUS).
I am trying to find out when workplace data will be available – do you knw, please?
Hi Roger, thanks for your query. You can find all the census data currently available related to work here: https://statistics.ukdataservice.ac.uk/dataset/?q=work&vocab_Year=2021
In terms of releases the best place to go is the ONS calendar: https://www.ons.gov.uk/releasecalendar?query=census&fromDateDay=&fromDateMonth=&fromDateYear=&toDateDay=&toDateMonth=&toDateYear=&view=upcoming
We aim to have the data from each release up on our platform as soon as possible, usually within the day or two.