 Dr Bożena Wielgoszewska, one of our #DataImpactFellows, discusses the recent research she has undertaken with colleagues at UCL on the gender wage gap project.
What did we find?
Professor Alex Bryson, Dr Francesca Foliano, Professor Heather Joshi, David Wilkinson and I found that the differences between men’s and women’s earnings has decreased, but that progress has slowed in recent years. Dramatic change only took place with major events, such as war or big policy change. Later cohorts seem to face better conditions but the gap is still large and, at our estimated rate of convergence, it will not close for another 40 years.
The Covid-19 pandemic has further highlighted labour market inequalities between men and women and raised questions about the future progression towards gender equality. Some expect that more widespread flexible working and normalisation of working from home will lead to greater gender equality. At the same time, others argue that the position of women, jeopardised by taking a bigger share of housework during lockdown, will reverse the progress.
Our analysis focused on two British birth cohorts available from the UK Data Service, one born in 1958 (tracked up to age 55), and one born in 1970 (tracked up to age 42). We supplemented this analysis by an examination of historic data covering the last 100 years and a review of existing studies.
What happened to gender equality over time?
Although the Covid-19 pandemic is unprecedented, history tends to repeat itself. Therefore, in order to fully understand how the gender pay gap will evolve, we first needed to evaluate what happened to the gender pay equality in the past, and how effective the past policy interventions were.
We took 1921 as our starting point, which is when the earliest statistics, for full-time manual workers are available. At this time women earned about a half (50%) on men’s hourly pay. Since then, the gap closed by 10 percentage points during World War Two and by another 10 percentage points in the 1970s, when the Equal Pay Act was introduced. However, since the 1970s the convergence has slowed. The recent statistics estimate the average gender pay gap in the UK at a little below 20%.
These changes to pay were accompanied by changes in other aspects of life. Women were gradually catching up with men in terms of education, until 1990s, when women eventually started to outperform men in tertiary education. During the same period, with an exception of a couple of peaks after World War Two, the number of births fell, and women’s labour market participation rates increased. Today, although more likely to work part-time, women account for nearly half of the workforce.
Where do the differences in pay come from?
Despite legislation mandating pay equality in the UK being 50 years old, women’s hourly pay is lower on average and, as shown in our research, expert opinions diverge as to why.
Some argue that different employment patterns reflect differences in preferences, while others that these differences reflect the constraints women face in the labour market, such as discrimination or societal expectations regarding gender roles.
These discriminatory practices can be further partitioned into
- taste-based discrimination (an overt prejudice or dislike towards a particular group)
- statistical discrimination (an inference about person’s qualities based on statistical characteristics of the group they belong to)
- stereotyping (fixed ideas that representatives of certain group are better at certain tasks)
The comparison of pay across men and women is further obscured, because there are various systematic differences between them in terms of their human capital (i.e. experience and education). For example, women take time out of the labour market to look after children more often than men and, once they have children, they are more likely to return to part-time work, which means they accumulate less full-time and more part-time experience on average.
Figure 1 below shows the estimated gender pay differentials in selected UK studies published over the last 50 years – both raw and adjusted for differences in human capital.
The comparison is shown as female-to-male ratios, so if the pay of men and women were equal, these ratios would be one, and anything below one indicates a male premium.
The raw estimates show that in 1971 married women earned about 0.5 of the male wage and, by 2015, this percentage increased for women as a whole to 0.82.
Taking account of differences in human capital between men and women always reduces the gap, bringing the rations closer to one. The magnitude of this adjustment is mostly due to work experience. It remained relatively steady over time. However, even the adjusted estimates have never reached the level of equality.

Figure 1: Estimated gender pay differences in previous studies (click image to enlarge)
Data sources: GHS – General Household Survey; WES – Women and Employment Survey; BHPS – British Household Panel Survey; LFS – Labour Force Survey
Previous studies mostly use cross sectional data, showing snapshots of the population over time. However, in order to investigate how the differences in pay develop over the course of peoples’ lives, we analyse the data obtained from the cohort born in 1958.
Figure 2 below shows the estimated pay ratios in this cohort, at ages when they were interviewed (23, 33, 42, 50 and 55). The black line, reflecting the ratio of raw estimates, is U-shaped – growing initially until the peak at age 42, but closing in later in life.
To better understand the factors behind these differences, we accounted for gender difference in education and work experience, as well as family formation.
The differences from all our models are similar at age 23, implying that differences in education, experience and family situation, albeit small at this age, make little difference.
Differences in education and family differences explain a small proportion of the gap, but the adjustment for work experience makes substantial difference, especially in later life. The differences in experience were particularly large for experience in full-time jobs. Part-time experience contributed little to women’s rate of pay.
When cohorts member were age 55, men still received an unexplained pay premium
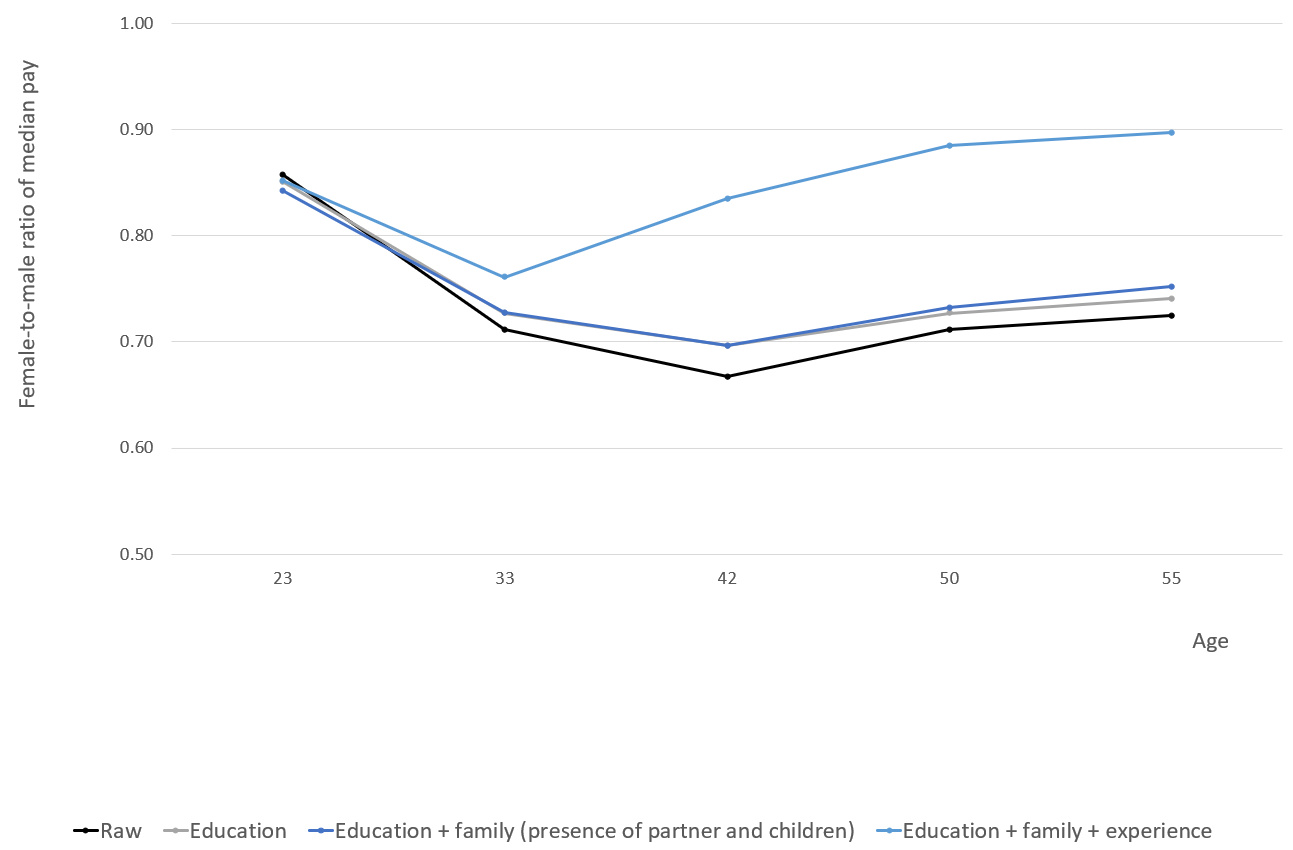
Figure 2: Raw and adjusted ratios in the 1958 cohort (click image to enlarge)
The cohort born in 1958 reached school leaving age around the time when the Equal Pay Act was introduced but, as shown above, the differences in pay still existed throughout their working lives. This led us to wonder whether the effects of the Equal Pay Act were more gradual.
To investigate this, we extended our analyses to the cohort born in 1970 and focused on the human capital adjustment. The differences in the raw and human adjusted ratios between the two cohorts are shown in Figure 3.
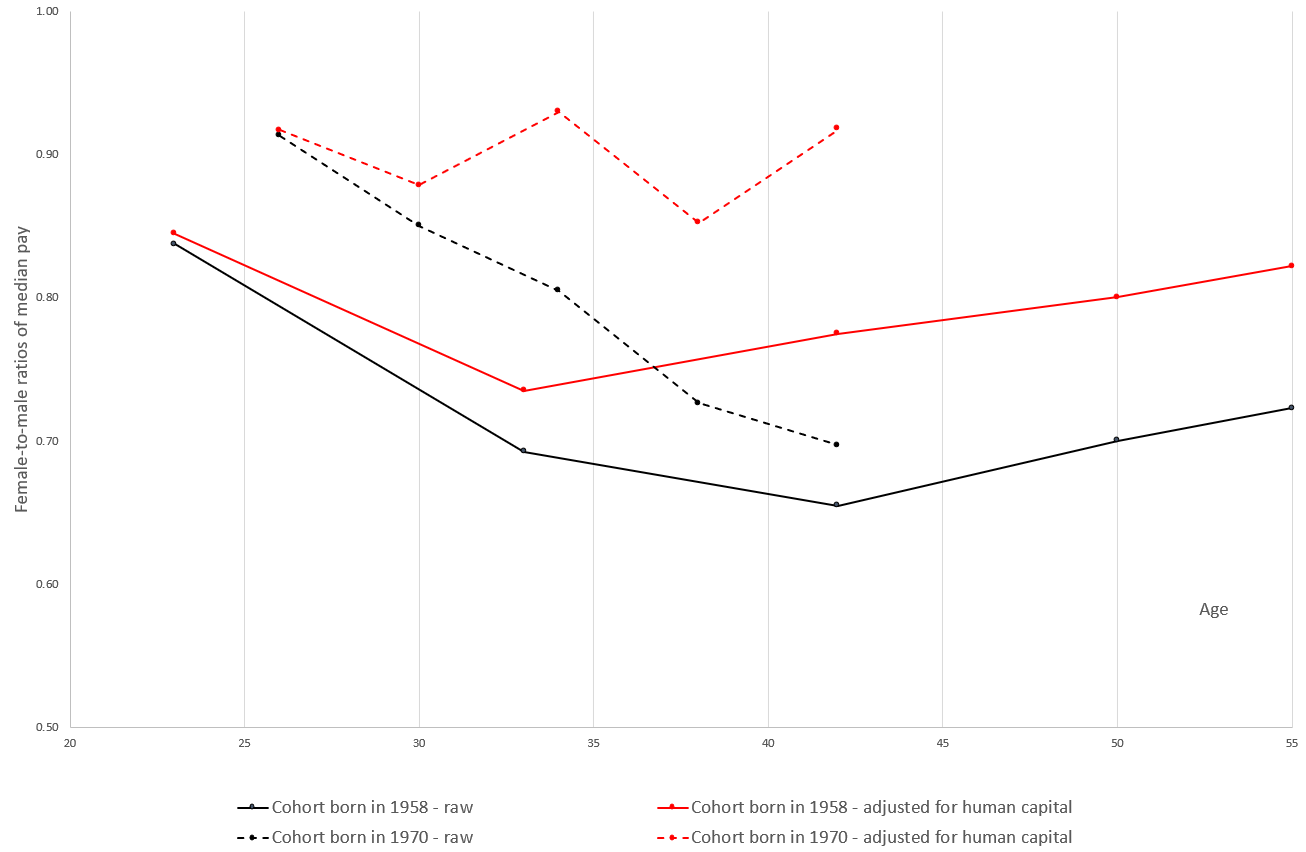
Figure 3: Cross cohort comparison of the raw and adjusted female-to-male ratios (click image to enlarge)
Comparing the two cohorts, we see that the estimates are closer to one for the more recent cohort at all ages and that, at least in mid-life, the proportion of the wage difference associated with human capital has grown. However, even in 2012 – when the members of the later cohort were age 42 – and even when we account for the differences in human capital, the ratios are still below one at only 0.92.
Lessons for policy
Although a number of key policies were implemented in recent decades in the UK aiming to equalise pay, at our estimated rate of convergence the gap will not close for another 40 years.
Following the Equal Pay Act of 1970, which outlawed the use of separate rates of pay for men and women, the gap substantially decreased. Since then, the Employment Protection Act contributed to increase in women’s employment rates; the Equal Pay Amendment of 1983 allowed equal pay for comparable work; the Statutory National Minimum Wage, reduced the gap at lower end of the distribution; the National Childcare Strategy provided free nursery education; and the Equalities Act made gender wage audits compulsory for large firms (until the pandemic lockdown).
Although more recent policies, such as Shared Parental Leave and Childcare for working parents, or indeed the impact of the pandemic, are yet to be evaluated, there is still room for new policy initiatives.
Based on our findings, equal opportunity policies facilitating employment for people with family responsibilities, could address the larger pay gap experienced by parents.
In addition to that, given the estimated pay gap exists amongst non-parents too, there is a need for better enforcement of anti-discrimination measures regardless of family status. Policies which tackle the ‘glass ceilings’ and ‘sticky floors’, by focusing on discriminatory employer behaviour in hiring practices or on affecting their practices by requiring greater transparency, also have the potential to ensure more rapid convergence. However, based on the evidence from the past, the policies that directly intervene in wage setting, such as Equal Pay Act and minimum wage, have been the most effective and should be a key component of future policies.
Publications
A Short History of the Gender Wage Gap in Britain | Oxford Review of Economic Policy
An adapted version of this blog post has also been published on UCL’s Institute of Education blog.
About the author
Bozena Wielgoszewska is one of the UK Data Service Data Impact Fellows 2019 and a Research Associate at the Centre for Longitudinal Studies.
She primarily works on a project which aims at harmonisation of the income and earnings data across three cohort studies: National Child Development Study (NCDS), 1970 British Cohort Study (BCS70), and the Millennium Cohort Study (MCS). Bozena started working on the Gender Wage Gap project in October 2019.
Bozena was awarded a PhD from the University of Edinburgh in July 2019.
Follow Bozena on Twitter.