 Niels Blom, one of our Data Impact Fellows, discusses his research looking at measures of violence in Understanding Society and the Crime Survey for England and Wales, and the opportunities this gives researchers.
Criminology has been hampered by a lack of longitudinal data to study the consequences of victimisation. However, recently ‘Understanding Society’, the United Kingdom Household Panel Survey (UKHLS), began fielding a small battery of questions relating to violence experience. Together with Dr. Vanessa Gash, in our recently published article, we examine the strengths and weaknesses of these UKHLS measures by comparing them to similar questions from the Crime Survey for England and Wales (CSEW), a widely used and well regarded, but cross-sectional survey. With this analysis, we hope to encourage other researchers to look at some of the long-term consequences of violent victimisation.
New opportunities for longitudinal study of violence
While the UKHLS was not primarily designed to study violence and its effects, and is consequentially rarely used by criminologists, it has recently extended a battery of questions originally intended for its Ethnic Minority Booster sub-sample.
Specifically, the UKHLS asks respondents of their experience of physical violence and “being insulted, called names, threatened or shouted at” as well as feeling unsafe and avoiding particular locations. These new variables have the potential to support significant developments in criminological research given the breadth of variables the UKHLS collects alongside its panel data structure. For example, now researchers can look at the link between violence and its effects on labour market dynamics (e.g., Gash and Blom 2023), socioeconomic positioning, family circumstances, and health, amongst others.
For the study of violence, the CSEW is already widely used in both policy and academic circles . Yet its annual cross-sectional nature does not allow for assessments of causal dynamics or of the possible long-term effects of criminal actions on its victims. Also, given the CSEW’s primary focus on measures of crime, it has few indicators relating to labour market, family circumstances or health compared to the UKHLS.
To assess the utility of the UKHLS for the study of violence, we compare the wording of the violence and fear of violence questions within the UKHLS and the CSEW, their prevalence and association with key demographics and its association with self-rated general health. We compare the associations between the violence indicators and demographics and health, next to comparing the question wording, to determine whether the UKHLS and CSEW measure similar things. If the violence measures are similar, their associations with other variables should be similar too. We focussed on three indicators: physical violence victimisation, being threatened, and feeling unsafe.
Physical Violence
Though both the UKHLS and the CSEW collect data via face-to-face computer assisted personal interviews (CAPI), the means by which the indicator on physical violence is collected is fairly different in each dataset. The UKHLS directly poses the following question to respondents: “In the last 12 months, have you been physically attacked in any of the places listed on the card? If so, which ones?”. Whereas the CSEW poses a series of screener questions regarding victimisation in the past 12 months, after which respondents are asked to provide a detailed account of each incident of victimisation. Trained coders subsequently assess these accounts to determine whether what has been reported by respondents represents a crime and, if so, which one. To determine an equivalent index as that collected in the UKHLS, we combined several offence codes.
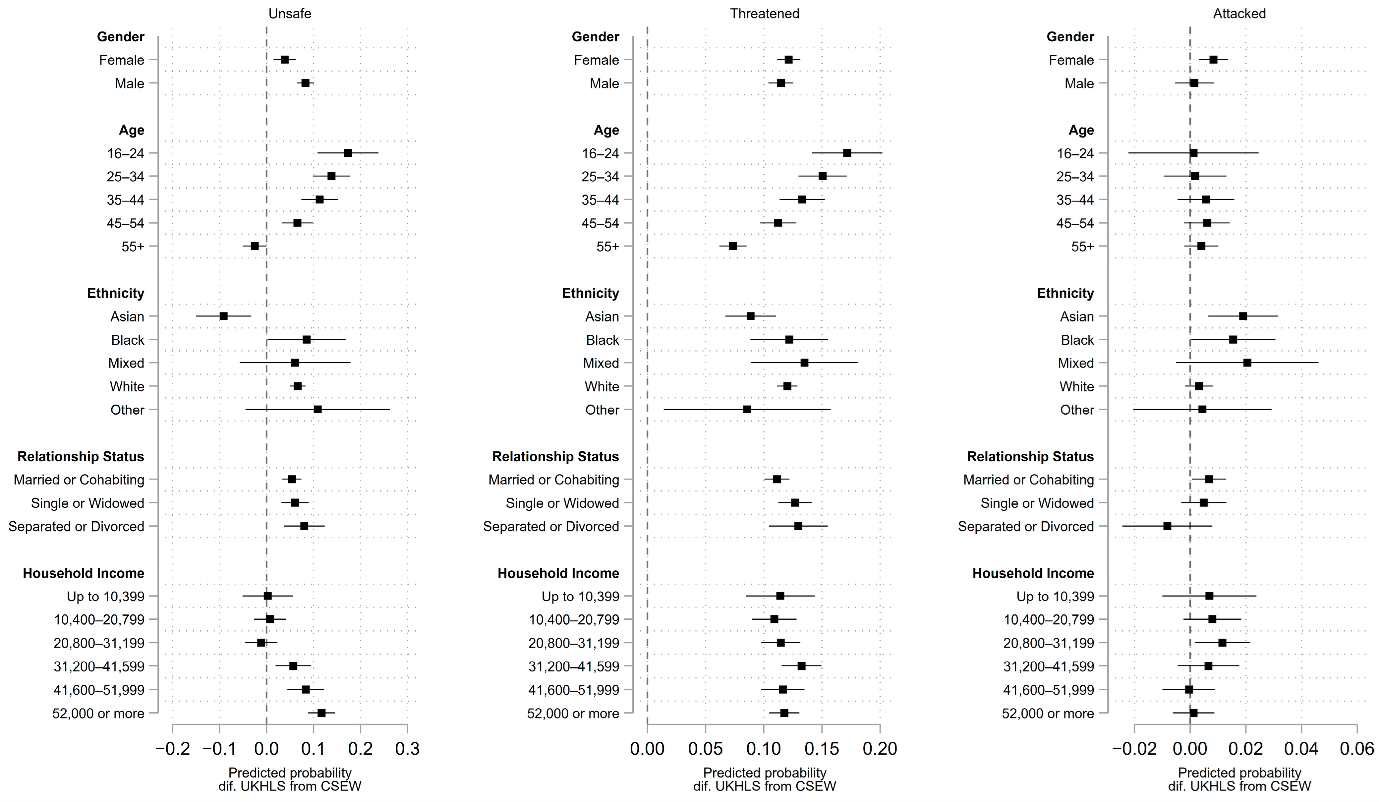
Even though the questions are asked differently, the prevalence of violence in the two datasets was very similar at about 2.3% in the UKHLS and 2.1% in the CSEW, shown in table 1. When we look at differences in the prevalence between key demographic groups in figure 1, the UKHLS and CSEW show similar prevalence for men, between age groups, for most ethnic groups and for household income. The UKHLS appears to pick up slightly more violence experienced by women and Asian (British) people compared to the CSEW. Importantly, physical violence is similarly associated with self-rated general health in both data sources. Together, this suggests that the UKHLS’s indicator on physical violence is very similar to the CSEW indicator for physical violence victimisation.
Threatened and insulted
The questionnaire wording for ‘being threatened’ are quite different in the two datasets. The UKHLS asks whether “in the last 12 months, have you been insulted, called names, threatened or shouted at, in any of the places listed on this card? If so, which ones?”. In contrast, the CSEW only focusses on the criminal classification of threatening someone. Similar to its collection of indicators on physical violence, once CSEW respondents answer positively to screener questions regarding victimisation, their detailed accounts are grouped into offence codes by trained coders, such as threat to kill or assault.
That the UKHLS asks about insults as well as threats whereas the CSEW asks solely about threats, is reflected in the differential prevalence: 14.1% using the UKHLS compared to 2.7% with the CSEW, as shown in table 1. Moreover, there are also significant differences in tendency by social groups in figure 1. However, when we look at the association between this indicator and self-rated general health, being insulted, called names, or threatened seems to be similarly related with health as the crime being threatened to be killed or assaulted. So, while the UKHLS indicator is much broader than the CSEW crime classification indicator, they are both quite strongly related to people’s health.
Feeling unsafe
Lastly, we compare the measures of feeling unsafe in both sets of data. The UKHLS asks respondents: “In the last 12 months, have you felt unsafe in any of these places? If so, which ones?”. While, the CSEW has a slightly more specific wording which asks respondents to consider if they have felt unsafe in (one) specific location and at night-time: “How safe do you feel walking alone in this area after dark? By this area I mean within 15 minutes’ walk from here.”
Despite notable variances in the questionnaire wording, we found a similar prevalence of feeling unsafe in both sets of data, with 27% of UKHLS respondents and 22% of CSEW respondents reporting feeling unsafe (table 1). However, we found men to be more likely to say they feel unsafe when they are not just asked about feeling unsafe in their own neighbourhood at night; in the UKHLS we found 21% of men reported feeling unsafe, whereas this was only true of 13% of men in the CSEW. Additionally, the UKHLS provides different age, ethnic, and household income patterns of feeling unsafe compared to the CSEW, as indicated in figure 1. Again though, the association between feeling unsafe and the self-rated general health is the same between the two datasets. Therefore, we conclude that the UKHLS measures something substantially different from the CSEW, but both are important for understanding different aspects of feeling unsafe.
Overall, we found a considerable overlap in the measures of violence in both the UKHLS and the CSEW, specifically physical violence. We hope that this will encourage future criminologists to exploit the longitudinal nature of the UKHLS, which can be usefully examined alongside its wide variety of socioeconomic, family, health, and lifestyle indicators. For instance, we are using it in our ongoing work on the labour market consequences of violence. We also found that the UKHLS’s wording of its indicators regarding experiences of ‘being insulted or threatened’ and of ‘feeling unsafe’, to be in line with calls to broaden understanding of violence beyond criminal definitions.
Table 1. A comparative analysis of the prevalence of violence in the UKHLS and the CSEW via sex/gender. Source: UKHLS wave 11 and CSEW 2019/2020.
| The UKHLS
(N = 23,883) |
The CSEW
(N = 27,922/6490 for unsafe) |
|||||
| Women | Men | All | Women | Men | All | |
| Fear of violence; feeling unsafe | ||||||
| Unsafe | 33.5 | 20.8 | 27.5 | 30.4 | 12.9 | 21.7 |
| Violence exposure; was insulted/threatened (0–1) | ||||||
| Threatened/insulted | 14.8 | 13.4 | 14.1 | |||
| Threat offence | 3.0 | 2.4 | 2.7 | |||
| Violence exposure; was attacked (0–1) | ||||||
| Attacked | 2.3 | 2.3 | 2.3 | |||
| Violent offence | 1.7 | 2.5 | 2.1 | |||
Figure 1. Predicted probabilities of violence and feeling unsafe for key sociodemographic groups. Based on average marginal effects and models in Table S4 of the Supplementary Material. You can view the image in a larger form here.
About the author
Niels is a Research Fellow at the Violence and Society Centre at City, University of London. Niels investigates violence and abuse and its relationship with labour market transitions, health, and wellbeing and works on a programme of work harmonizing and integrating data from various surveys and administrative records. In much of his previous work, Niels analysed how economic inequalities within and between couples are related to relationship outcomes, such as partner relationship quality, marriage, separation, and childbearing. Prior to joining City, Niels completed his PhD in Sociology at Radboud University in the Netherlands and worked as a researcher at the University of Southampton and University of Bath.