 David Martin, one of the UK Data Service Deputy Directors, has worked since 1996 on the design of census geographies in England, Wales and Northern Ireland.
With the next censuses to be held on 21 March for these three parts of the UK (with Scotland’s census taking place in 2022), David talks about the importance of the census as a foundation for our population statistics and boundaries, highlighting their relevance to monitoring Covid-19.
Followers of UK Covid-19 statistics over the last year will likely have seen the maps of prevalence rates on many news outlets and on the interactive map which is part of the UK Government’s Coronavirus Dashboard.
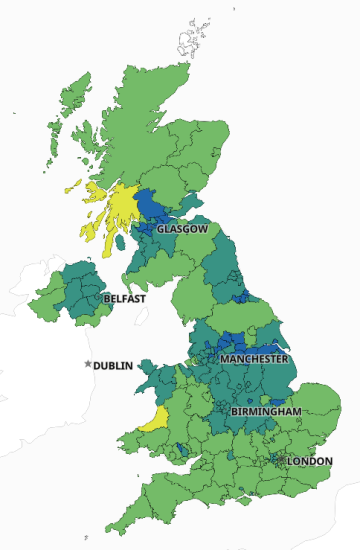
Image: Snapshot of interactive map on UK Government Coronavirus dashboard, seven–day rolling rate of new cases by specimen date ending on 11 Mar 2021
In England, the most detailed areas are known as Middle Layer Super Output Areas (MSOAs), typically containing populations of around 7,800. The fact that MSOAs and the prevalence rate data exist at all is very much due to the census of population.
Counts of people with a disease, or with any other characteristic, only fully make sense as proportions of a relevant population. The reason that we understand the Covid-19 pandemic to have affected some age, ethnic and socioeconomic groups – and some places – more severely than others, is that we have appropriate denominator data for every group and area.
The decennial census is the key source of that information – for example the small area populations and the ethnic group breakdowns are not available in such detail from anywhere else. Although there are official population estimates each year, they still draw on data from the previous census, while even the largest surveys are only ever based on relatively small samples and administrative data sources do not consistently cover even these core characteristics.
The census tells us about a vast range of things – such as migration, travel to work, housing stock and car ownership, family structures and household relationships – but it is absolutely critical to our understanding of the basic counts, without which prevalence rates cannot be meaningfully calculated.
Turning to the geographical areas, the MSOAs are built up from two layers of smaller geographical areas – census Output Areas and Lower Layer Super Output Areas (LSOAs). Output Areas were first created for the 2001 Census and represented a major break from previous practice.
Rather than designing areas by hand in advance of the census, the Output Areas were computer-generated using an automated zone design process once the data had been collected, ensuring that every area contained a broadly similar population count and meeting a host of other design requirements, most importantly that no population is too small to protect the confidentiality of the people that live and work there.
Output areas in England have a mean population size of 309 and the same techniques were used to group them into Lower Layer Super Output Areas (LSOAs, mean population 1614), and subsequently into the MSOAs mentioned above.
The different layers are appropriate for publication of different types of statistics, for example the LSOAs are the basis for the government’s official indices of deprivation. Similar approaches are used in Wales and Northern Ireland, but with some differences in area names and sizes.
So the census provides us not just with some of the most important numbers, but also with a geographical framework that allows the consistent publication of a huge range of key statistical information, and 2011 data continue to underpin important aspects of our understanding of the Covid-19 pandemic.
David developed the original software used to create Output Areas and has continued to advise and support the geographical work of the Office for National Statistics for 2011 and 2021 Census. He has also spent much of his time representing the data needs of census users.
The UK Data Service provides a unique range of census data outputs and resources, including access to census datasets dating from 1961 to 2011. Our expert team hosts data about areas, data about migration and travel-to-work flows between areas, digital boundaries, lookup tables, and samples of anonymized records.
We also support research users with access to more secure and detailed versions of some of these data held by the census agencies. We engage extensively with the UK agencies to advocate for census data users and provide a wide range of training and advice – and we are standing by to support the critical research and insight that will be based on 2021 census results.
Read other blog posts in our Census 2021-2022 series, which will continue beyond census day.
About the author
David Martin is a Professor of Geography at the University of Southampton and a Deputy Director of the UK Data Service. He has been involved in several major data initiatives, including as Director of ESRC’s former Census Programme. His research in geographic information science led to development of the system of census output areas currently used in England, Wales and Northern Ireland. David was awarded an OBE in 2019 for services to Geography and Population Studies.