Richard Wiseman Socio-economic Data Services: Specialist Support Officer and Celia Russell, International Data Specialist at the UK Data Service, present a series of data in the UK Data Service collection relevant to analyses of the North West and Greater Manchester regions and possible comparators, nationally and internationally, ahead of the ‘Northern Powerhouse in the world open data dive‘.
As part of the ESRC Festival of Social Science, the UK Data Service and Digital Innovation are running an intense all-day Open Data Dive on Wednesday 9 November at The Shed at Manchester Metropolitan University (MMU).
The Manchester Data Dive will bring together coders, data enthusiasts, graphic designers, project managers and pizza lovers to hunt down, crunch and beautify open social and economic data about Manchester and the North West region.
The Challenge: The Northern Powerhouse in the World: On 5 May 2017 Greater Manchester will have a new Mayor: Your gift to her/him – a SWOT* analysis of Greater Manchester and the Region – internationally….
* Strengths, Weaknesses, Opportunities, Threats
Prizes will be given for projects which could give the Mayor an immediate head start in knowing what works – and what needs more focus – in the aim of cementing Greater Manchester and the North West Region in the Northern Powerhouse as an International Powerhouse. As with our last Open Data Dive we’ll be offering the opportunity to 3D print the winning dive, which was GB House Prices by area, by @philmikejones:

We host a huge amount of open data at the UK Data Service:
- We make available international data from a variety of international organisations such as the OECD, World Bank and the IMF. These data give figures for countries and some for regions, over time, often annually, but also some quarterly and monthly data.
- We also hold UK Census data, from 1971 to the most recent census in 2011. These data give detailed information concerning people and households for a variety of geographies, from country level, right down to Output Area level (areas containing an average of 309 people in England and Wales). In addition we host UK boundaries that complement the data, enabling researchers to map these data and combine data from other sources.
Thinking about the Northern Powerhouse in the world, here we show just a small selection of the data to relevant to analyses of the region and possible comparators. We have undertaken comparisons of a range of regions in the UK and internationally with those in the North West and Greater Manchester.
In 2001 the population of England stood at just over 49 million, in the 2011 census there was a rise to 53 million, meaning a population increase of almost 8%.
The change in population varied across England, in the map below you can see the darker areas are where the population has risen, whereas the lighter colours show either a fall in population, or only a modest increase.
Population Change in England at local authority level and equivalents between 2001 and 2011 (%)
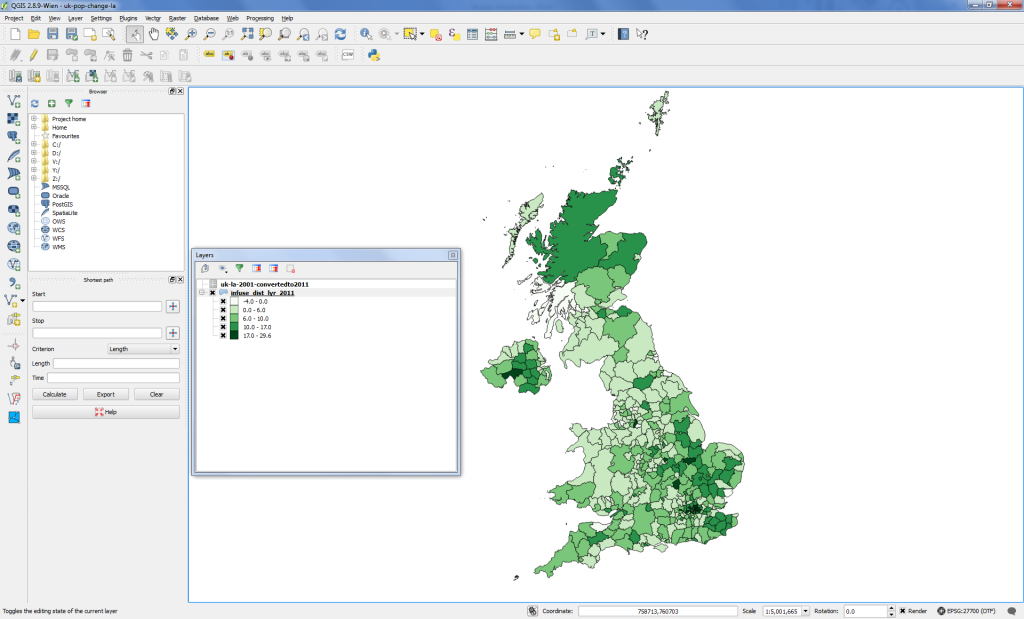
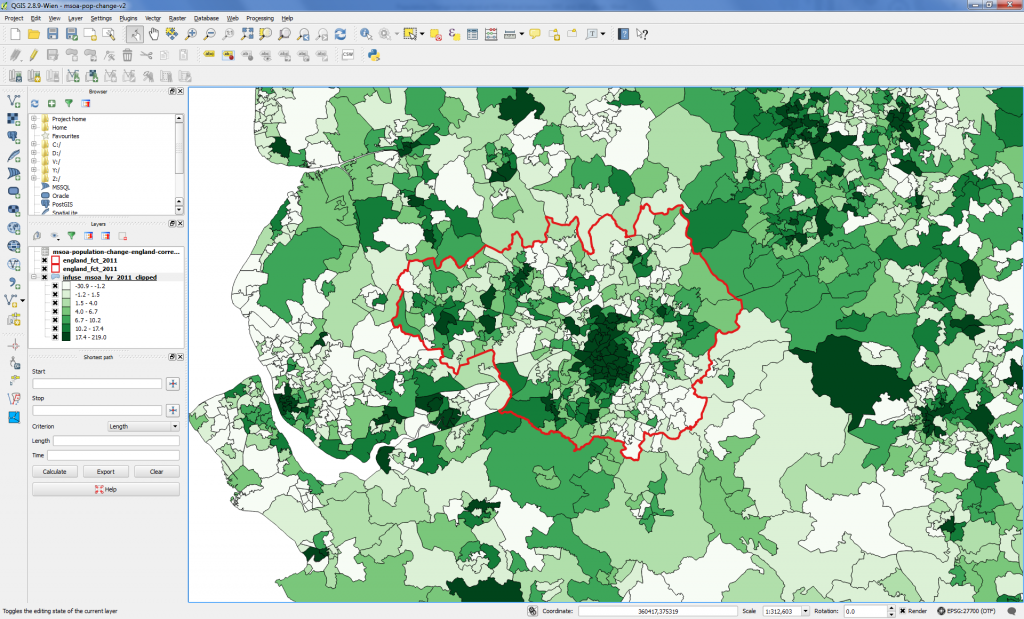
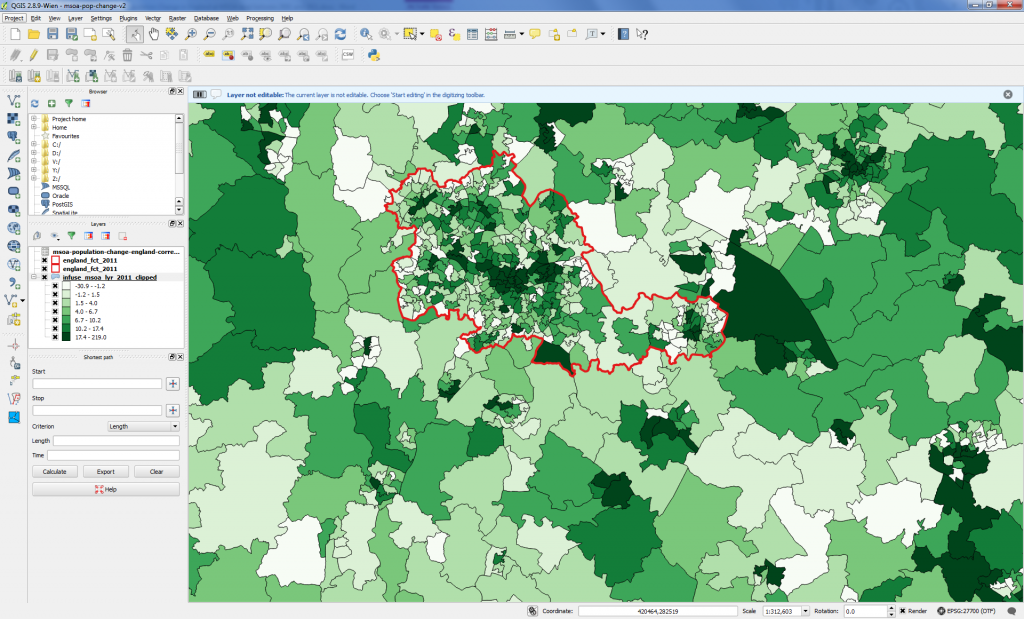
This map uses the geography MSOA (Middle Layer Super Output Areas), which has an average of 7787 people. As you may expect, the area size of MSOAs in built up areas will be a lot smaller, meaning you cannot see differences so easily at this scale. Below you can see the population change for both Greater Manchester and the West Midlands.
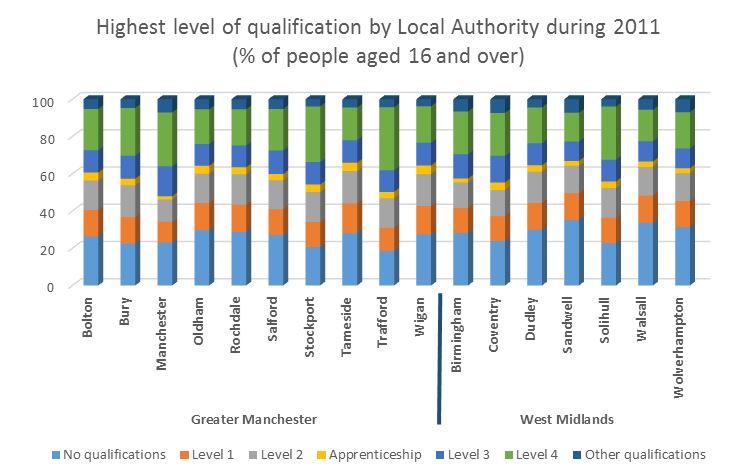
Qualifications – 2011 Census
The chart below shows the proportion of people by their highest level of qualification for each Local Authority. Details of what the different level of qualifications mean can be found on the InFuse topic definition page.
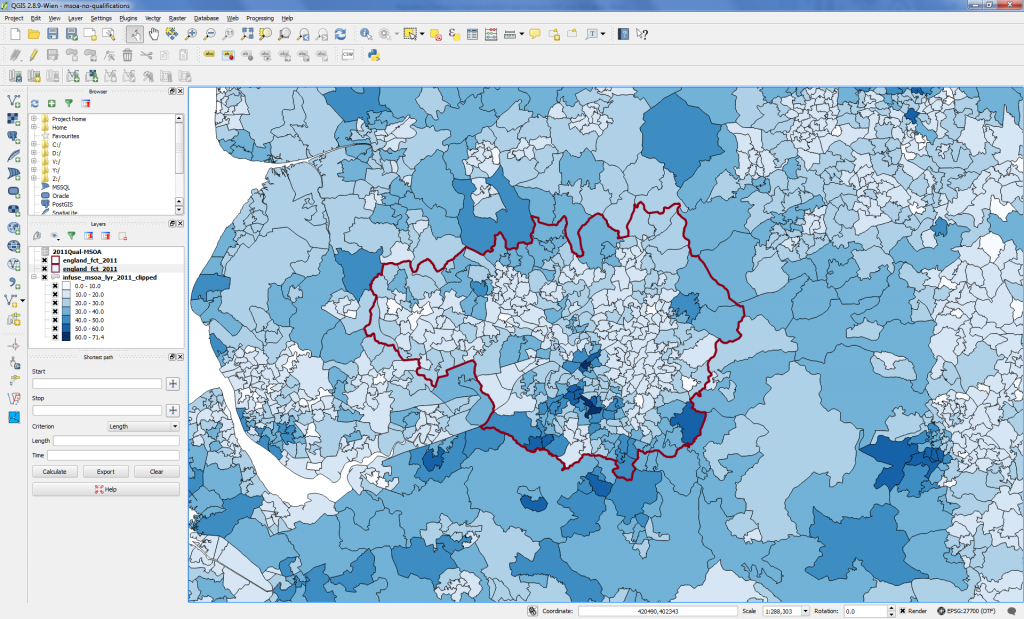
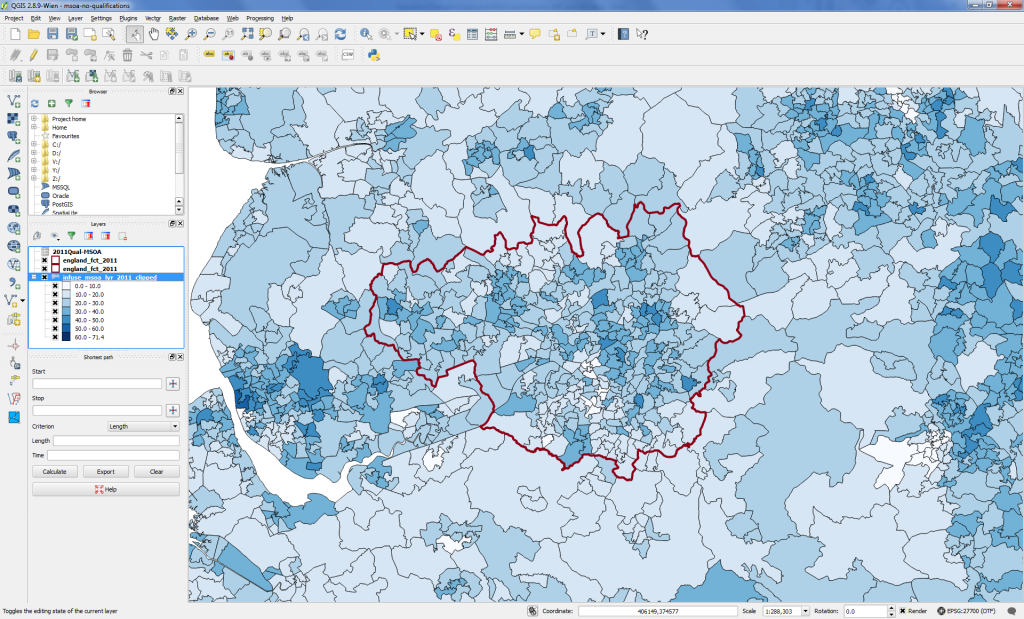
The next maps show the proportion of people with no qualifications and who have obtained a degree and above for areas within Greater Manchester and the West Midlands, a lighter colour indicates that there are a higher proportion of people in the given area.
Greater Manchester – Degree and above (% of people aged 16 and over)
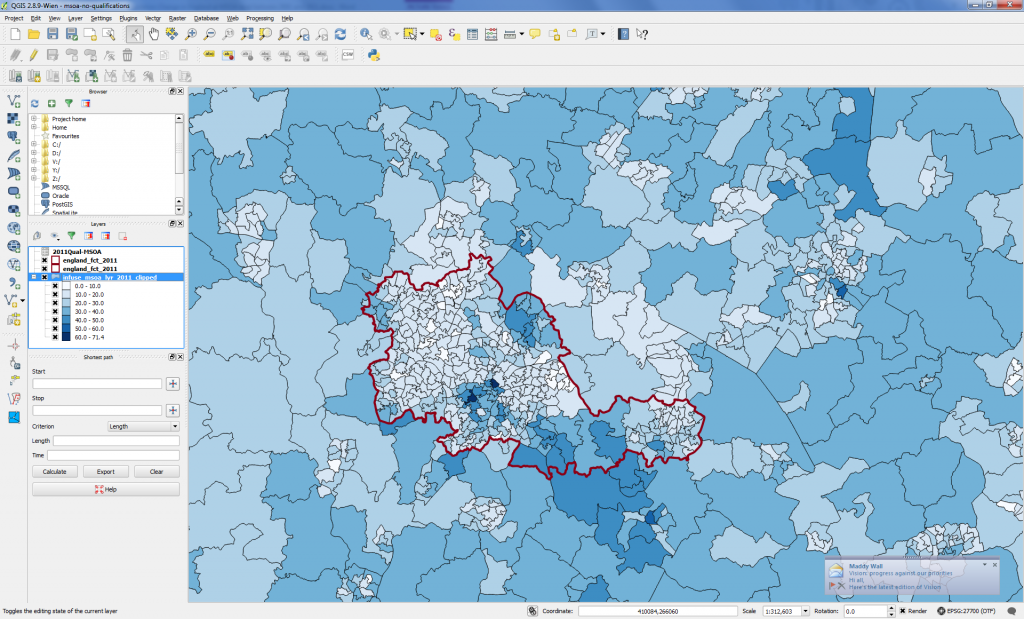
Looking at Greater Manchester and West Midlands a breakdown of Local Authorities can be seen against the figure for England.
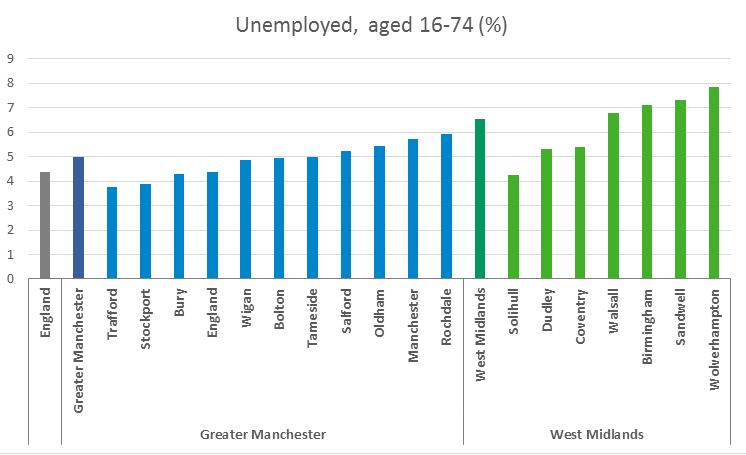
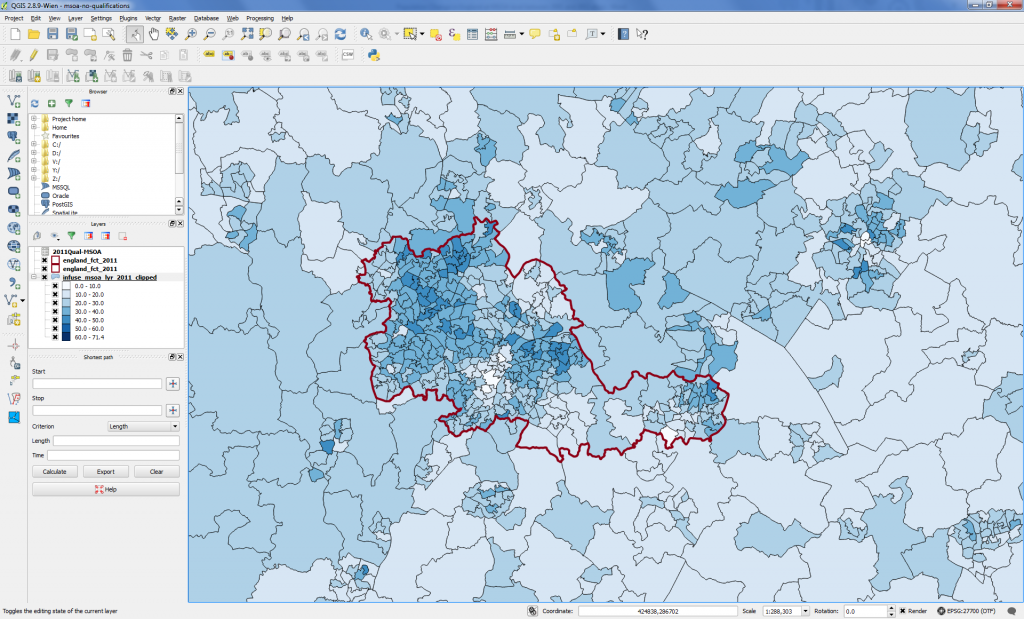
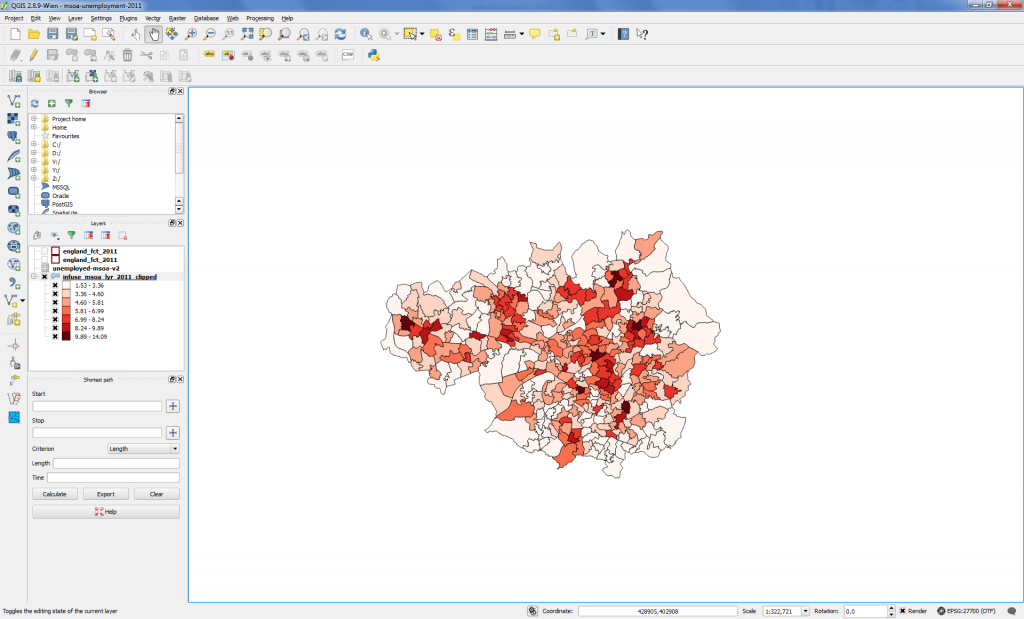
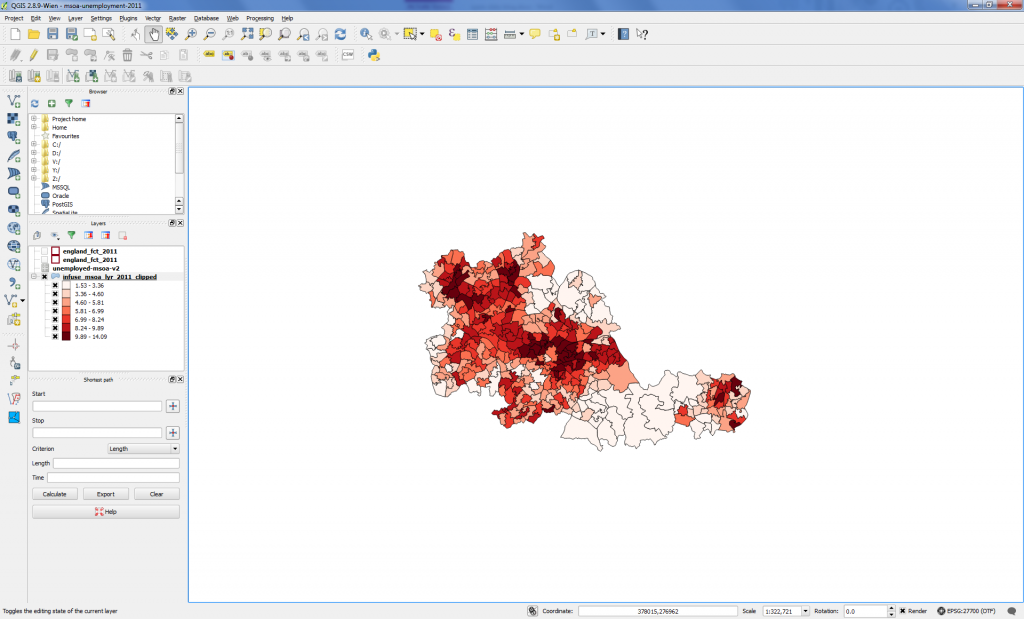
Again mapping these data to MSOA level you can see the darker colours represent the higher levels of unemployment.
Greater Manchester (% of people aged 16-74) – Unemployed
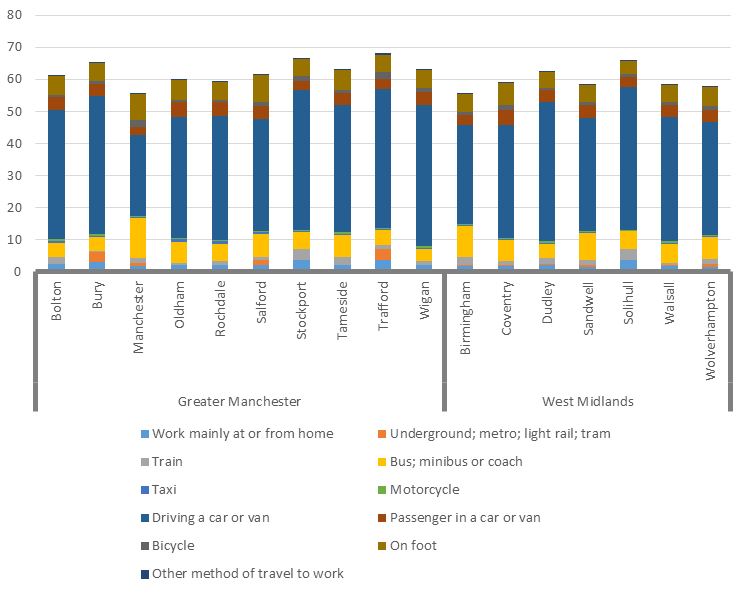
Means of travel to work (% of people in employment aged 16-74)
These are just a few examples of census data which are available. But there are much more covering topics such as ethnicity, religion, national identity, passports held, country of birth, tenure, accommodation type, second homes, and general health. What is so unique about the census is that topics are often cross tabulated and can be available at small geographical areas. Data from the 2011 and 2001 censuses can be found at InFuse, and data from 1971-2001 census from Casweb. There are also flow data where there is an origin and a destination (e.g. commuting and migration). This can be found by using Wicid. Boundary data from 1981 to 2011 can be downloaded from Easy Download or Boundary Data Selector.
Most of the international data that we host in our UKDS.Stat interface covers country level data, but there are some regional level data, In particular the OECD Regional Statistics. In this dataset you can compare Northwest England to other regions in the World. Here is an example from the “Demography Statistics” showing Males aged over 85 for a number of regions from 1996 onwards.
OECD Regional Statistics: Demography Statistics (male population aged 85+)
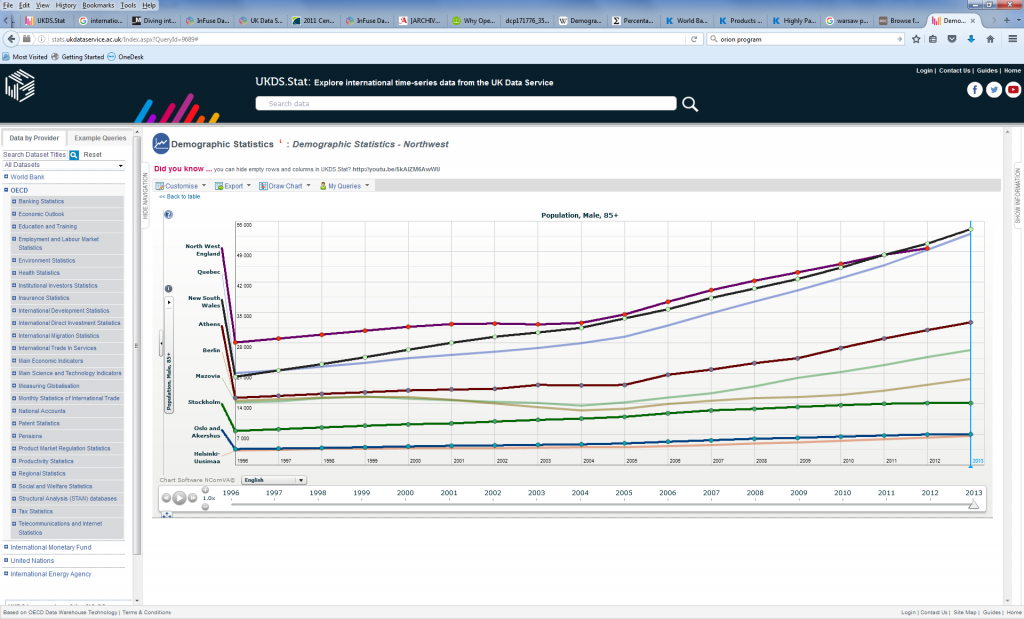
https://stats.ukdataservice.ac.uk//Index.aspx?QueryId=9689
Data concerning Labour market including youth and gender employment rates as well as place of work can be found in the “Labour Statistics”.
OECD Regional Statistics: Labour Statistics (youth unemployment)
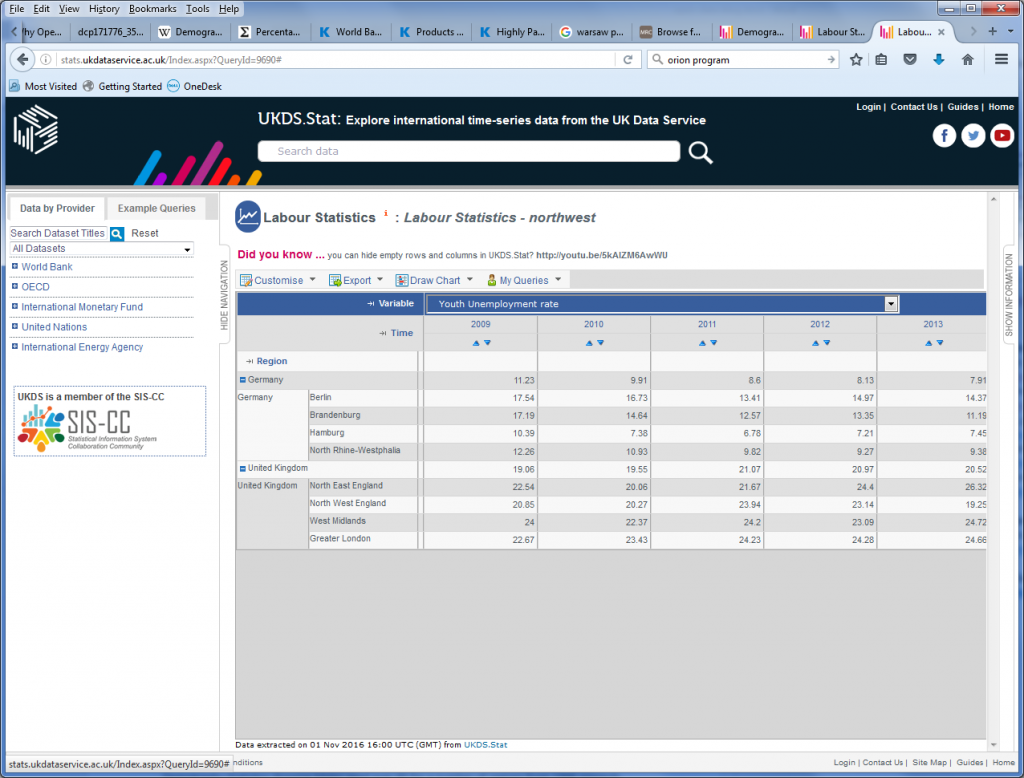
https://stats.ukdataservice.ac.uk//Index.aspx?QueryId=9690
Social indicators including health, crimes and environmental indicators can be found in “Social Indicators”. Below you can the “physician rate” (general practitioners and specialists per 1000 inhabitants) for a number of regions during 2010.
OECD Regional Statistics: Social Indicators (physicians rate)
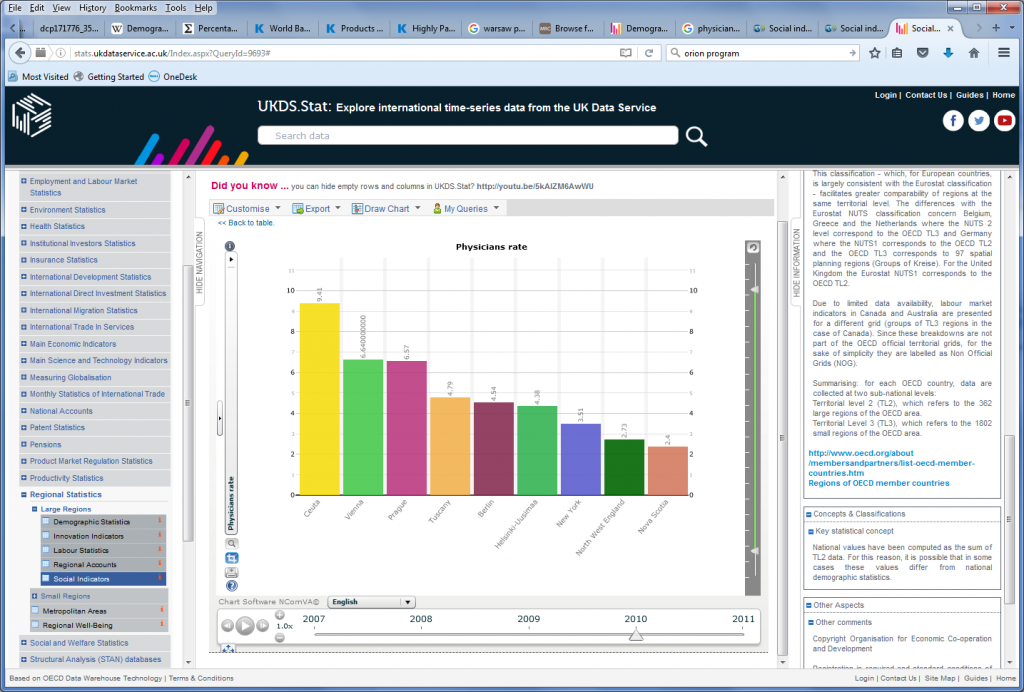
https://stats.ukdataservice.ac.uk//Index.aspx?QueryId=9693
The “Regional accounts” dataset include various GDP measures. Below you can see an example of Disposable Household income.
OECD Regional Statistics: Regional Accounts (Disposable Household Income)
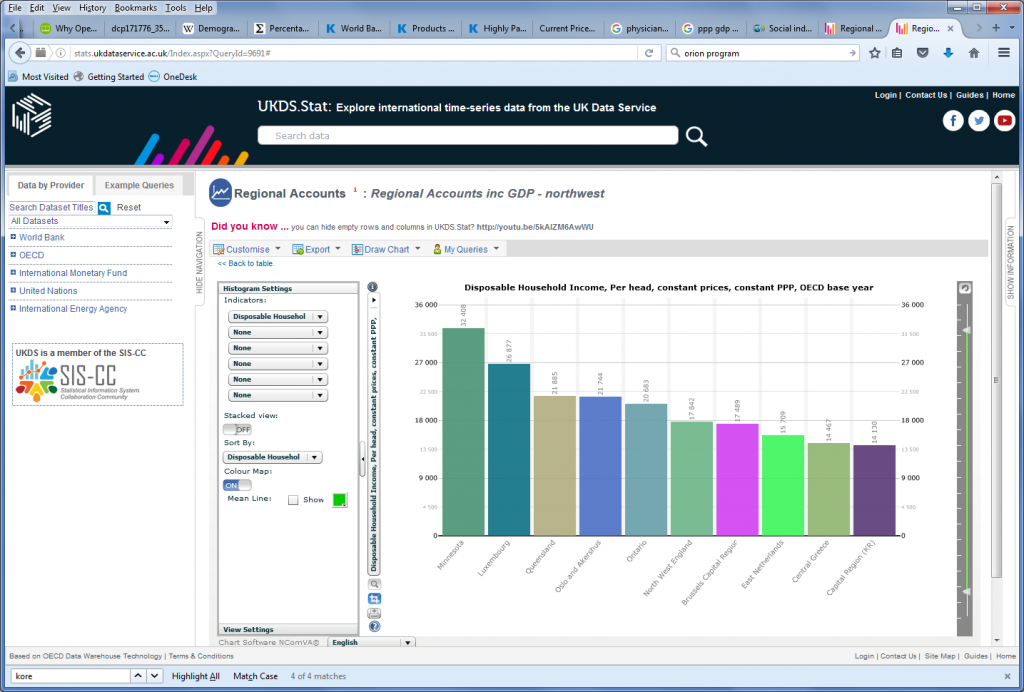
https://stats.ukdataservice.ac.uk//Index.aspx?QueryId=9691
Regional well-being includes variables such as regional income distribution, internet access and voter turnout in general elections. Below you can see voter turnout for regions in the UK and Germany during 2013.
OECD Regional Statistics: Regional Well-Being (voter turnout in UK and Germany 2013)
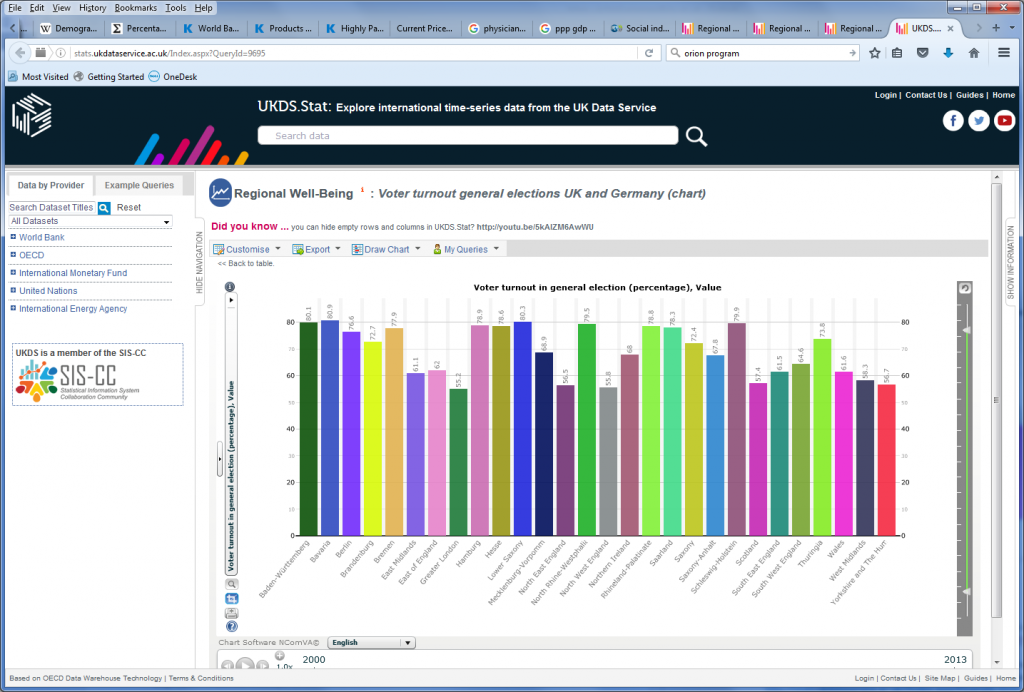
https://stats.ukdataservice.ac.uk//Index.aspx?QueryId=9694
These are just some examples of data in the UK Data Service collection relevant to analyses of the North West and Greater Manchester regions and possible comparators, nationally and internationlly, ahead of the ‘Northern Powerhouse in the world open data dive‘. We look foward to seeing you there.