 In the second of two blog posts, Dave Rawnsley and Chris Daly explore usage of the UK Data Service’s international and census data, and how data citation can demonstrate how far data-enhanced research reaches.
In our previous blog post, we explored how downloads of international socio-economic data have changed in comparison with our ‘Fruits of Data Citation’ review in 2016. Views and downloads are one thing, but we want to see how and where the data is being used, the impact it is having and the stories it is telling.
Citation stories
The UK Data Service encourages researchers to cite its data correctly.
We use Digital Object Identifiers (DOI) assigned by the International DOI Foundation to provide a persistent link to the data even if its location changes. The UK Data Service’s Deputy Director, Dr Victoria Moody recently explored some of the benefits of using persistent identifiers such as DOIs, particularly in the context of REF2021.
We have been using DOIs since 2010 and they have allowed us to view the use and impact the data is having in academic papers. We can track DOIs in Google Scholar and download the information on their use, such as the number of citations. In addition, where possible, we can view the journal articles to gain an idea of how our data is being used.
The last time we ran this exercise we created word clouds based on the terms used in the research publication titles of articles that used our data. This time we’ve changed them slightly to separate out UK census and international socio-economic data into their own word clouds based on a heart and butterfly shapes, ones we thought reflected these coronavirus-changed times – made using WordClouds.com.
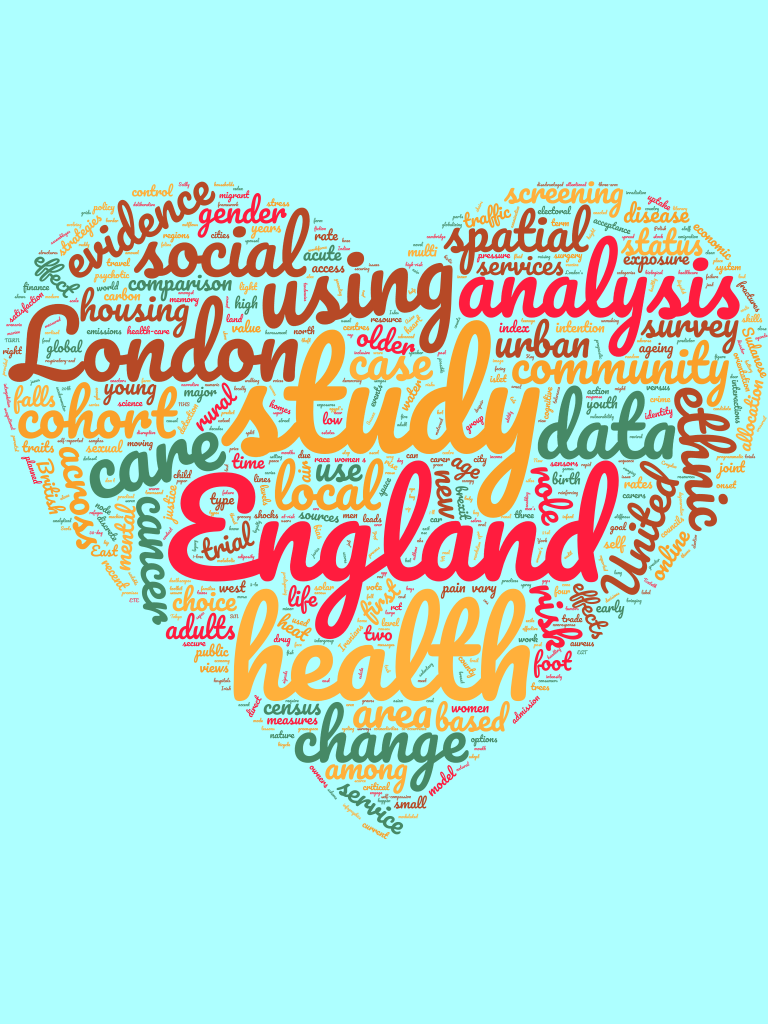
The first word cloud includes words from papers and articles that cited data downloaded from our census applications. Particularly prominent amongst these words are England, London, study, health, analysis, data, care, social, ethnic, evidence, cohort and change.
Figure 1. Word cloud: research using aggregate Census data downloaded from the UK Data Service
In the second word cloud, the importance of energy from the international socio-economic articles is quite apparent along with decarbonising, heat, environmental and CO2. There is also a heavy emphasis on articles citing England but also in there are references to Brexit and COVID.
Figure 2. Word cloud: research using international socioeconomic data downloaded from the UK Data Service
Harvesting the publications citing socio-economic aggregate data
As before, we used Google Scholar to find papers that cited our data using the following search terms. We used separate search terms for our platforms so that we could get a more granular understanding of how the data was being used.
- For international data:
doi.org/10.5257 OR stats.ukdataservice.ac.uk
- For census data:
doi.org/10.5257/census
- For InFuse Census data:
infuse.mimas.ac.uk OR infuse.ukdataservice.ac.uk OR dx.doi.org/10.5257/census
- For Casweb Census data:
casweb.mimas.ac.uk OR casweb.ukdataservice.ac.uk OR dx.doi.org/10.5257/census
- For GeoConvert conversion:
geoconvert.mimas.ac.uk OR geoconvert.ukdataservice.ac.uk
OR dx.doi.org/10.5257/census
Positively, we found that census users are now more regularly citing our data using the appropriate DOI. Going forward, we will develop plans to encourage and support our international data users to cite data they use in research.
The Google Scholar search for all publications from 2017 to 2020 citing census and international data obtained via the UK Data Service returned 838 articles (at time of writing) with a wide variety of subjects from COVID to energy efficiency via loneliness, third sector sports organisations and the detection of county lines criminal gangs.
The following list of research publications are the ten most cited articles. Citations numbers at time of writing.
- Cited 283 times – C Maringe, J Spicer, M Morris, A Purushotham, E Nolte, R Sullivan, B Rachet, A Aggarwal. ‘The impact of the COVID-19 pandemic on cancer deaths due to delays in diagnosis in England, UK: a national, population-based, modelling study’. 2020. The Lancet, Elsevier. Used Index of Multiple Deprivation from GeoConvert via UK Data Service.
- Cited 140 times – P Davies, C Evans, HK Kanthimathinathan, J Lillie, J Brierley, G Waters, M Johnson, B Griffiths, P du Pré, Z Mohammad. ‘Intensive care admissions of children with paediatric inflammatory multisystem syndrome temporally associated with SARS-CoV-2 (PIMS-TS) in the UK: a multicentre observational study’ 2020. The Lancet, Elsevier. Used Census 2011 data from InFuse via the UK Data Service.
- Cited 82 times – JJ Anderson. ‘Carbon Taxes and CO 2 Emissions: Sweden as a Case Study’. 2019. American Economic Journal. Used IEA Energy Prices and Taxes data from Stat via the UK Data Service.
- Cited 65 times – E Kaufmann. ‘Levels or changes?: Ethnic context, immigration and the UK Independence Party vote’ 2017. Electoral Studies. Elsevier. Used GeoConvert to create a common geographical basis for comparison.
- Cited 63 times – A Abdellaoui, D Hugh-Jones, L Yengo, KE Kemper, MG. Nivard, L Veul, Y Holtz, BP Zietsch, TM Frayling, NR Wray, J Yang, KJH Verweij & PM Visscher. ‘Genetic correlates of social stratification in Great Britain’. 2019. Nature Human Behaviour. Used 2011 Census data from InFuse via the UK Data Service.
- Cited 49 times – ‘Persistence and change in interregional differences in entrepreneurship: England and Wales, 1921–2011’. 2016. Environment and Planning A. Sage Publishing. Used Census data from Casweb via the UK Data Service.
- Cited 49 times – C Ballard-Rosa, M Malik, S Rickard, K Schreve ‘The economic origins of authoritarian values: evidence from local trade shocks in the United Kingdom’. 2017. Journal of Political Science. Used 1991, 2001 & 2011 Census data from Casweb and InFuse via the UK Data Service.
- Cited 44 times – L Kuijer, M Watson. ‘‘That’s when we started using the living room’: Lessons from a local history of domestic heating in the United Kingdom’ 2017. Energy Research and Social Science. Elsevier. Used 1971 Census from Casweb via the UK Data Service.
- Cited 42 times – JJ Bailey, DS Boyd, J Hjort, CP Lavers, R Field. ‘Modelling native and alien vascular plant species richness: At which scales is geodiversity most relevant?’ 2017. Global Ecology and Biogeography. Wiley. Used 2001 Census data from Casweb via the UK Data Service.
- Cited 41 times – A Curl, J Clark, A Kearns. ‘Household car adoption and financial distress in deprived urban communities: A case of forced car ownership?’. 2018. Transport Policy. Elsevier. Used 2011 Census data from InFuse via the UK Data Service.
It is clear that our up-to-date list of most cited articles has more citations than the previous list. Is this due to the uptake of DOIs, the greater use of citation services such as Bibtex or Refworks, or the greater use of Google Scholar? Perhaps more data and research are required.
One thing is certain, looking at the journals that the articles appear in, the use of International Socio-Economic and Census Aggregate data is used in more areas of research than we thought possible –
- Accounting
- Business & Management Studies
- Conflict and Peace Studies
- Health Education
- Linguistics
- Medicine
- Ornithology
- Paediatrics
- Psychiatry
- Sports Sciences
- Theology
- Vaccinology
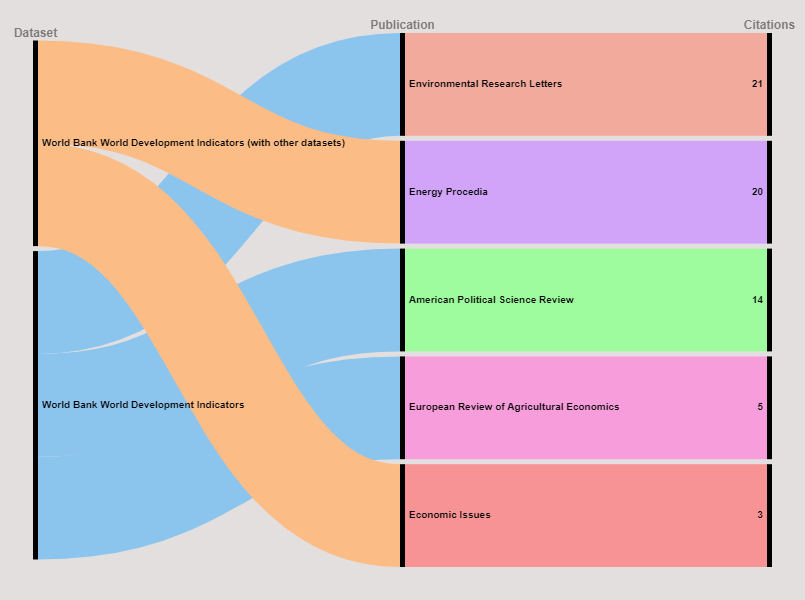
We used a selection of the citation data collected from Google Scholar to create a fluvial diagram to visualise the data. We used a free open source web app called RAWGraphs, which allows you to create graphs and diagrams from imported data tables.
Figure 3. This diagram shows where the World Bank World Development Indicators were used in research, with or without other datasets available in our collection.
The research appeared in five different journals, shown on the diagram in descending order of number of citations:
- American Political Science Review (14 citations)
- Economic Issues (3 citations)
- Energy Procedia (20 citations)
- Environmental Research Letters (21 citations)
- European Review of Agricultural Economics (5 citations)
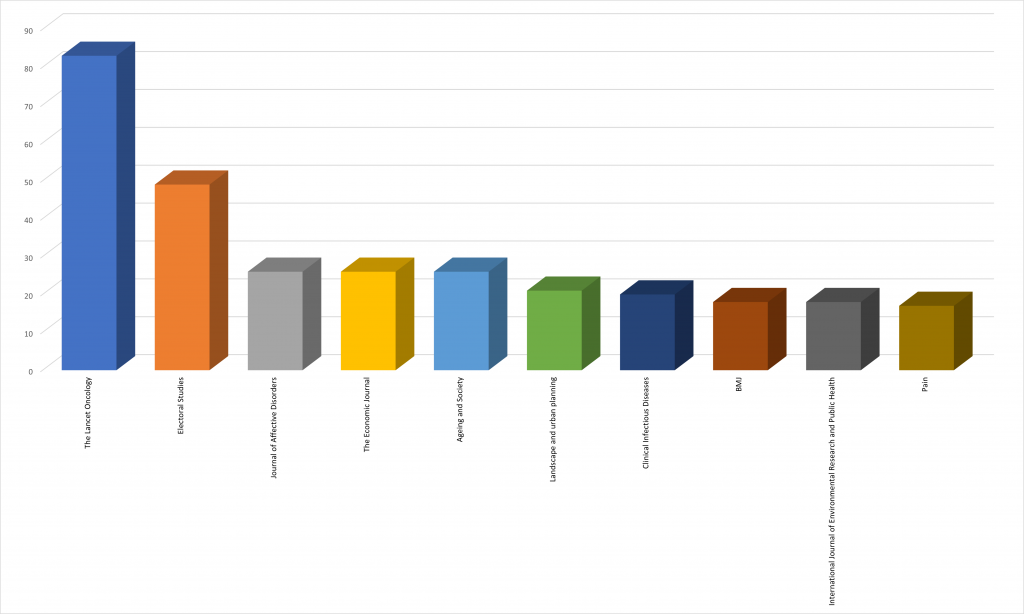
We made another interesting discovery when exploring citations of GeoConvert (which is an enabler of research, allowing linkage of spatial-based data). While the platform tends to be accessed less than our other census platforms, it has the largest number of citations. The paper with the most citations is The impact of the COVID-19 pandemic on cancer deaths due to delays in diagnosis in England, UK: a national, population-based, modelling study at 83.
Figure 4. Ten journals with the most citations of Geoconvert (view data in separate tab)
We noticed that there was a diverse range of journals which cited GeoConvert:
- The Lancet Oncology (83)
- Electoral Studies (49)
- Journal of Affective Disorders (26)
- The Economic Journal (26)
- Ageing and Society (26)
- Landscape and urban planning (21)
- Clinical Infectious Diseases (20)
- BMJ (18)
- International Journal of Environmental Research and Public Health (18)
- Pain (17)
By harvesting citations periodically in this way, we will continue to find out more about what is being done with the data we provide, but we’re always keen to hear directly from our users – so if you’re using any socio-economic aggregate data (international or census) in your research or teaching and would like to submit a case study of your data use we’d love to hear from you.
Other resources
- Open Data at the UK Data Service
- Publications on Google Scholar citing international data from UK Data Service.
- Usage statistics for our international data dissemination platform
- Case studies demonstrating data use and its impact
About the authors
Dave Rawnsley is the Senior Technical Co-ordinator and Chris Daly is Senior Technical Officer, both part of the UK Data Service aggregate data team, based at Jisc.


