The UK Data Service‘s Louise Corti and Scott Summers update us on the recent event: Supporting civil society organisations to gain insights and develop impact from data
On 17 October the UK Data Service ran an event at The Studio in Manchester focused on opportunities and challenges for professionals working with administrative, monitoring or evaluation data in civil society organisations (CSO). Attendees from a wide range of charities and civil society organisations including Asthma UK, Scope, The Salvation Army, Crisis, Action on Hearing Loss and 42nd Street, and non-departmental public bodies, including Historic England, took the opportunity to meet to explore ways of managing and sharing data ethically and discussing how data can be used to demonstrate the impact of their activities.
Neil Serougi , Fellow of Academy of Science, opened the day with a key-note speech focusing on how CSOs can build partnerships, for example with universities, and how they can articulate their impact to create effective communication strategies, in particular by shaping a narrative ‘upfront’. Neil set the tone for the day with an engaging discussion about developing partnerships and defining impact from various perspectives.
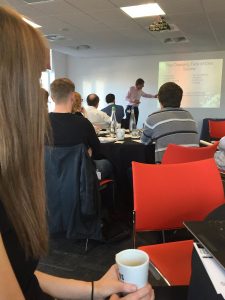
- CSOs collect a wide variety of data including at an individual level on such areas as contributors, staff and volunteers, and information on applications, grants, finances and other transactional information; and use a wide range of software and formats to store this data, with most being proprietary based systems. Many of the participants were undertaking data analysis and reporting, with an objective to enhance their data collection, management, internal sharing, storage and security practices.
- Participants also spoke about how they share data through publishing results in reports, or reporting information for use in national datasets or for public authorities. Louise outlined some practical guidance on setting up data inventories, and data input plans that include classification rules; as well as data storage and backup, protection and security; and the value of taking a ‘whole organisational approach’ to the governance of data.
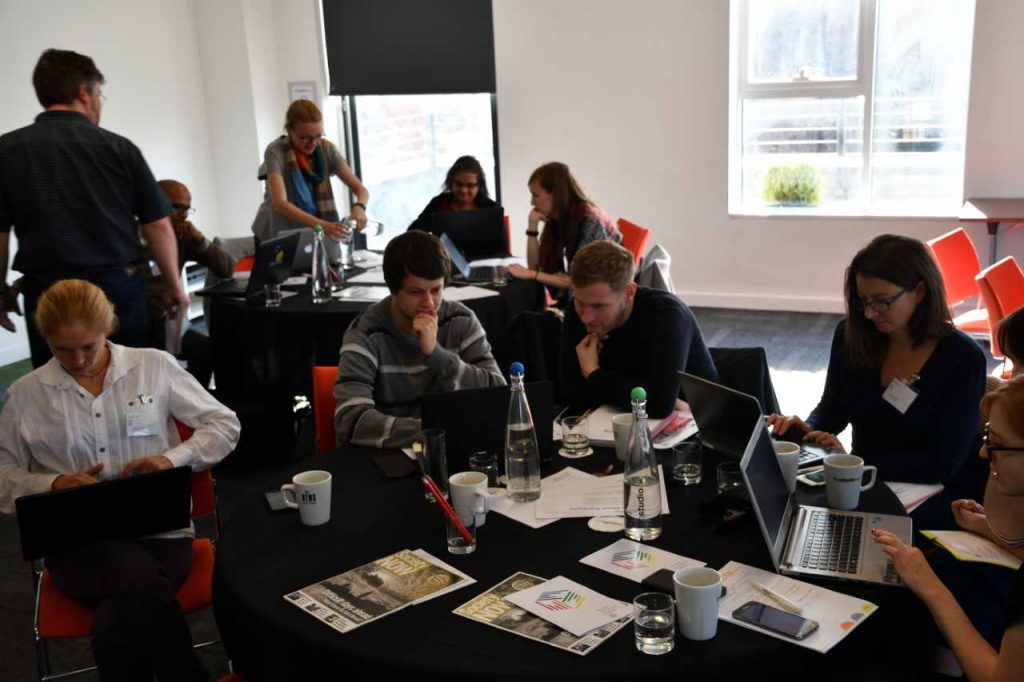
The debate chaired by John Mohan, @johnfmohan, Professor of Social Policy at University of Birmingham and Director of Third Sector Research Centre, saw Dan Corry, @DanRCorry Chief Executive of New Philanthropy Capital and Karl Wilding @karlwilding, Director of Public Policy and Volunteering at the National Council for Voluntary Organisations pitch against each other on ‘Measuring impact: pleasure or pain?’, Dan explored what works in CSO impact measurement and the challenges they face – particularly with regards to the level of evidence required for evidential credibility. Dan pointed to eight innovations in impact measurement and evaluation in the CSO sector, including user-centric evaluation, data linkage, big data, remote sensing, data visualisation, share measurement and evaluation, impact management and theory-based evaluation.Karl began by noting that if an organisation demonstrates its impact then the resources and funding will follow. While Karl suggested this is not necessarily the case in practice, he observed that people are keen to know charities are making a difference, how efficient they are, what it costs to run and how they fund advertising. Karl explained that organisations would benefit from making impact information available in a digestible format for a wide audience.
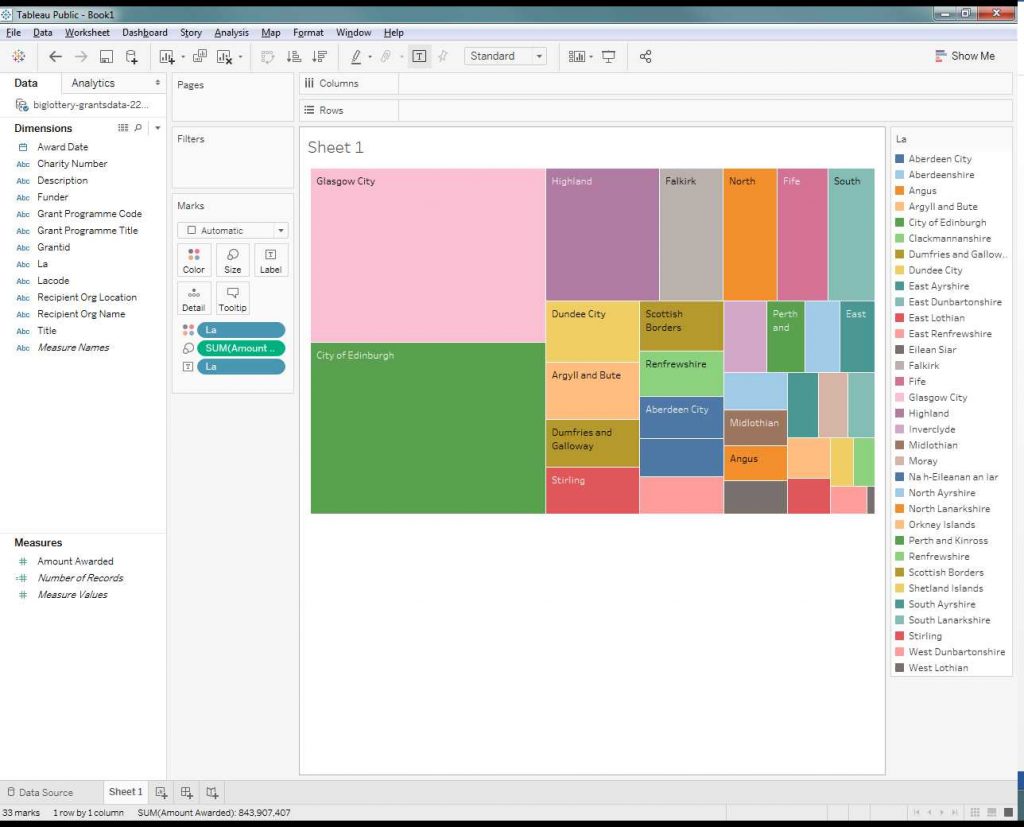
Alasdair Rutherford, @AltEcon from the University of Stirling, led a short introduction the art of data visualisation, where participants explored various award-winning infographics. One example, The Magnificent Bears of the Glorious Country of Finland, demonstrated how, “data visualisation can help make complex patterns in data easier to understand. There are lots of fancy data visualisations out there, some more like works of art. But by combining even just a little bit of good design principle with your data analysis, you can make a big difference to the story that you’re trying to tell with your data.” The session helped set the scene for the following Tableau Public hands-on lab session on using the free tool, Tableau Public. The three open data sources used in the session were: Big Lottery grants awarded to charities based in Scotland;
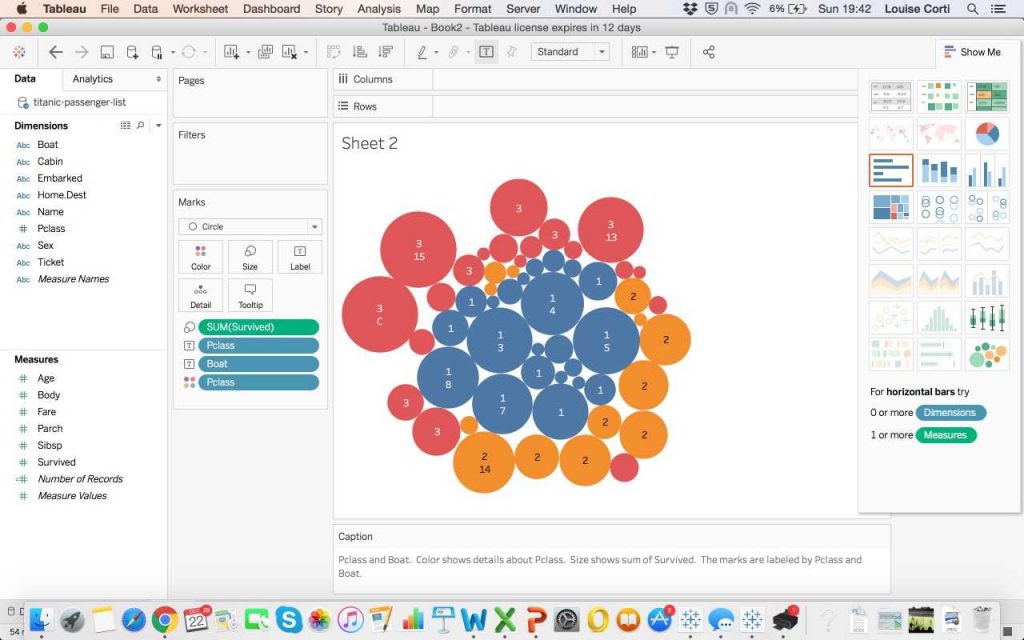
the Titanic Survivors data, about the passengers who traveled on the Titanic including the individual’s sex, age, destination, ticket type and whether they survived the disaster;
and the England and Wales Indices of Multiple Deprivation:
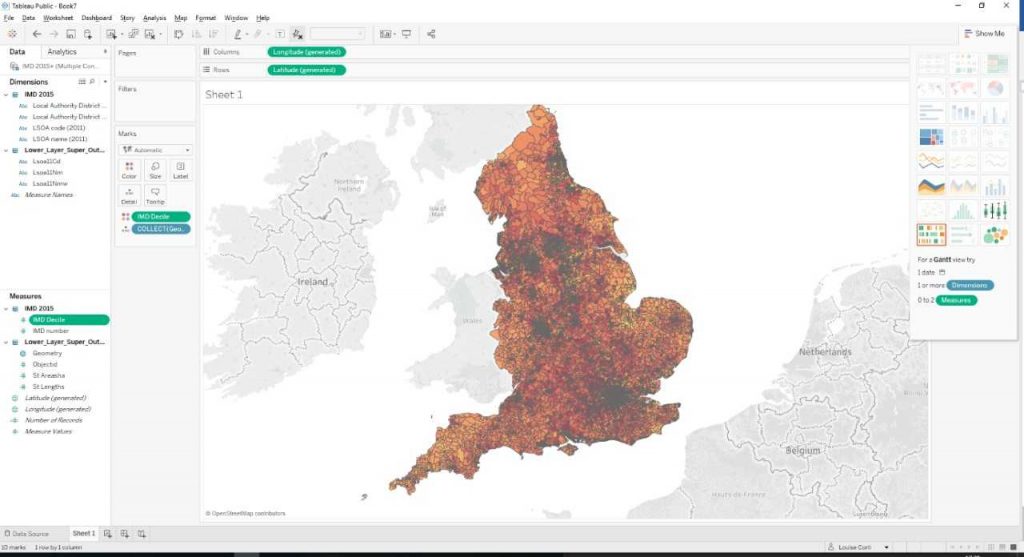
Data sources used in visualisation session:
- Big Lottery grants database for Scotland: https://www.biglotteryfund.org.uk/-/media/Files/Research%20Documents/aOpenDataFiles/open_data_2015_2017.xlsx
- Titanic Passenger list: https://public.tableau.com/s/sites/default/files/media/titanic%20passenger%20list.csv
- Department for Communities and Local Government (2017) English Multiple Indices of Deprivation 2015, 30 September 2015. https://www.gov.uk/government/statistics/english-indices-of-deprivation-2015
- Office for National Statistics (2017) Open geography Portal Lower layer Super Output Area boundaries, 2011. https://geoportal.statistics.gov.uk/datasets/90e15daaaeef4baa877f4bffe01ebef0_2
Participants said:
Useful civil society sector data resources can be found here: www.thinkdata.org.uk


