

Tom Pottrill, Policy Officer at Resolve Poverty, introduces the latest version of the North West Poverty Monitor for 2026, which draws on almost 50 indicators to reveal the scale and nature of poverty across the region.
Join Resolve Poverty and guest speakers next week for a free webinar on using this data to inform local anti-poverty action.
We all know that data is indispensable to effective, strategic approaches to tackling poverty.
It helps us to define poverty locally, in terms of its drivers and impact. It supports us to develop policies and design services that tackle poverty with intersectionality at heart. It underpins efforts to advocate and campaign for national policy change in domains like social security.
And it forms a core part of the evidence many of us need to secure funding in pursuit of the above.
But the process of collecting and interpreting such data can be daunting, particularly for the less ‘data-savvy’ among us, sometimes to the point that the scales balancing effort and reward do not seem to tip in our favour…
The North West Poverty Monitor is designed with this in mind: it is an easy-to-navigate tool which equips you with the evidence you need to tackle socio-economic disadvantage in your work.
The data is presented through a combination of maps, charts and tables, including several interactive visualisations, so that you can easily identify and compare specific data.
High reward, low effort.
What does the latest Poverty Monitor tell us?
The Poverty Monitor paints a picture of the stark inequalities across the North West and of how poverty is experienced by people in our communities, whether it is being paid a wage below the poverty line, or being charged rent that costs almost half the monthly pay packet, or not being able to heat the home or put a meal on the table due to prohibitive cost.
The Monitor serves as a salutary reminder that poverty, in all its complexity and nuance, always means a lack of financial resources in the household to meet basic needs and fully participate in society.
It is no coincidence that where there is a high proportion of households claiming Universal Credit, more children are in poverty; eligibility is based on low earnings, yet Universal Credit pays too little to lift many families out of poverty.
Nor should come it as a surprise that local authorities in the North West with some of the highest child poverty rates, such as Blackpool or Pendle, also have very high rates of fuel insecurity; people in poverty in such areas have inadequate income to meet essential costs.
Likewise, it is not accidental that places with the smallest gaps between monthly rent and income, such as Manchester or Salford, also have some of the highest numbers of people claiming supporting with housing costs through Universal Credit or Housing Benefit; families in poverty are often subject to high housing costs that cannot be met by earnings.
Though it is designed to support with such costs, real-terms cuts in the value of Local Housing Allowance (LHA) continue to compound income shortfalls and render social security futile in preventing significant numbers of children being pulled into poverty after housing costs are deducted. And that’s before we consider the many families who do not claim their full entitlements due to complexity and stigma inherent to the system.
More than that, the Poverty Monitor reveals that poverty is not the preserve of the poorest areas, with places considered to be relatively more affluent still facing significant pockets of deprivation.
Take the Wirral, for instance. Its headline child poverty rate (after housing costs) is on par with the national average, and lower than the North West average, yet the gap in the proportion of pupils eligible for Free School Meals (FSM) progressing to higher education and those ineligible is one of the most pronounced in the North West.
To put that into context, almost 3 in 10 children are eligible for Free School Meals in the Wirral, one of the highest proportions across the North West. This presents a real risk that those children are locked into intergenerational disadvantage and locked out of a future where they can realise their full potential.
The bottom line is that we must focus our collective efforts on increasing incomes and reducing costs for low-income families, if we are to support them to enjoy the full fruits of contemporary society.
How can the Poverty Monitor support my work?
The Poverty Monitor provides an essential evidence base for local and regional authorities, charities and community organisations, policymakers and researchers working to support people tackling socio-economic disadvantage.
We collate almost 50 indicators, split up by seven themes including:
- Poverty and deprivation
- Education
- Fuel and food insecurity
- Housing and homelessness
- The labour market
- Social security and debt
- National poverty data.
The selected indicators are based on data availability and on feedback we have received on the previous version of the North West Poverty Monitor and its predecessor, the Greater Manchester Poverty Monitor.
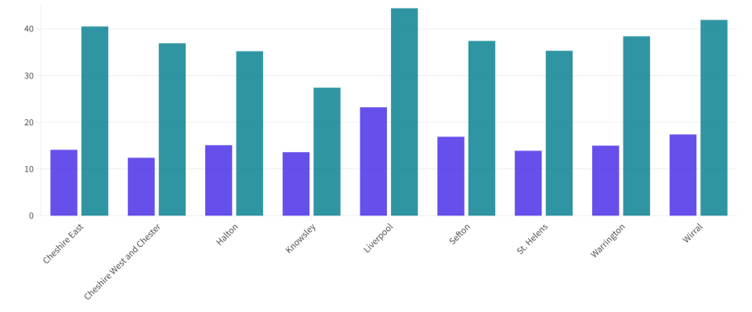
Most data are available at a local authority level. For instance, the latest data on the percentage of students progressing to higher education by Free School Meal eligibility is available for each local authority in the North West in 2024/25. Below, we show the data for Cheshire & Merseyside local authorities.
Figure 1 – Percentage of students progressing to higher education by Free School Meal eligibility in Cheshire & Merseyside local authorities
Some visualisations paint a more localised picture with data at electoral ward, Middle-layer Super Output Area (MSOA) or Lower-layer Super Output Area (LSOA).
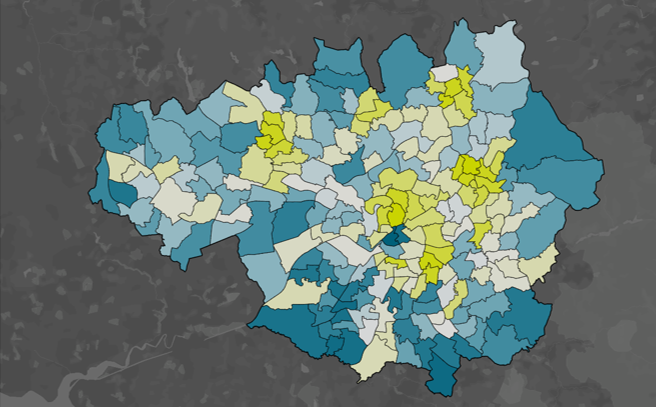
For instance, the latest relative child poverty rates (before & after housing costs) are available for each ward in the North West in 2024/25. Below, we show child poverty rates (after housing costs) for wards in Greater Manchester.
Figure 2 – Child poverty rates (after housing costs) in Greater Manchester wards
We also visualise various indicators for national poverty data based on the relative low income (AHC) measure of poverty.
These are drawn from the latest Household Below Average Income (HBAI) data series, accessed through the UK Data Service and published in March 2026, with data pertaining to 2024/25. When viewing this data, do consider our note of caution which explains what a recent change in the methodology for its calculation means for its interpretation.
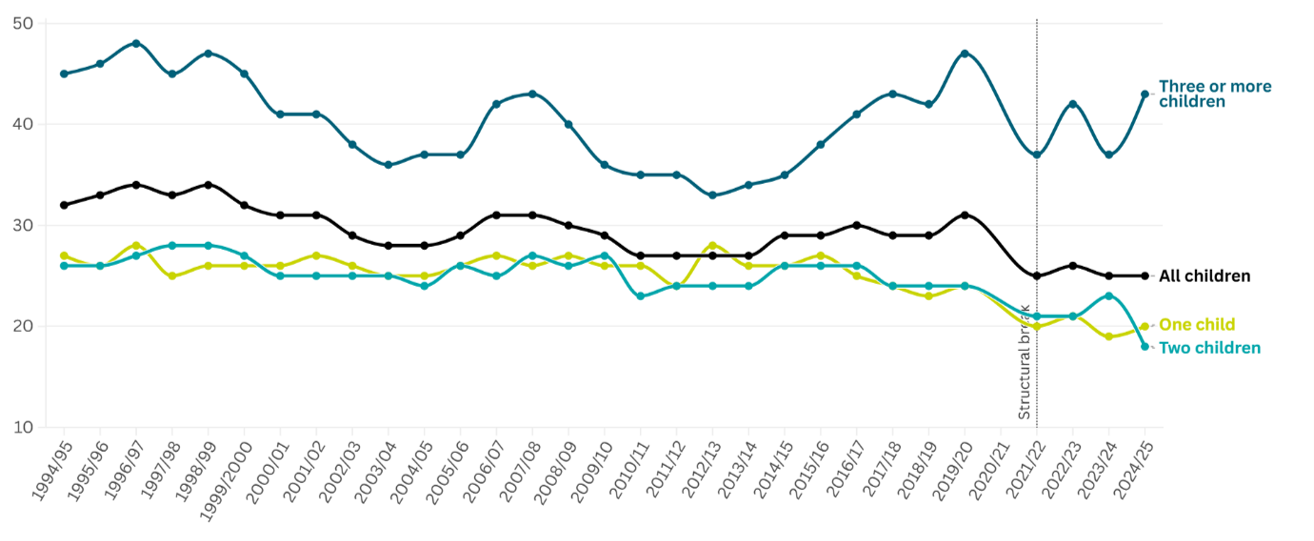
For instance, the latest child poverty rates based on the number of the children in the household is available as time-series data from 1994/95 to 2024/25. As shown below, child poverty rates became more pronounced in larger households over recent years owing to the two-child limit on benefits.
Given the two-child limit was only removed by central government in April 2026, it is too early to judge the effect of its removal on child poverty rates. However, we do expect this effect to be borne out in the coming years, beginning with the release of 2026/27 data, on condition that there are not countervailing forces that weaken the net impact of the policy.
Figure 3 – National child poverty rates by number of children in the household
The Poverty Monitor was fully updated in July 2026 to display the latest data (at time of publication) for all but a few of the indicators across all themes of the Poverty Monitor.
The indicators that have not been updated are those for which new data will be released under the next Census in 2031, and those for which no new data has been published or announced.
Join Resolve Poverty for a free webinar session on 15 September, exploring how to use poverty data effectively to inform local anti-poverty action.
Led by Tom Pottrill (Resolve Poverty), we will be joined by guest speakers Eve Little (UK Data Service) and Momoko Nishikodo (Geographies of Ethnic Diversity and Inequalities project) who will respectively highlight how you can use national poverty data and a new Ethnic Group Deprivation Index to develop effective local activity.
About the author
Tom is a Policy Officer at Resolve Poverty, focusing primarily on how different levels of governance can design, implement and evaluate strategic responses to poverty.
To this end, he develops policy ideas, conducts qualitative and quantitative research, and delivers consultancy and training for bodies to more effectively tackle poverty. Prior to joining Resolve Poverty, Tom completed a Public Policy MSc at UCL and a degree in Politics, Philosophy & Economics (PPE) at the University of Manchester. Tom is determined that the institutions that govern us, the public services that provide for us, and the public policies that shape our lives should recognise and execute their role in addressing poverty.
Comment or question about this blog post?
Please email us!