 Jo Webb from the UK Data Archive, a partner in the UK Data Service, explores what upending a very familiar visualisation can tell us about how people deal with change.
In my last blog post I discussed change management using Marie Kondo’s programme as an example. The idea for the post came from a workshop on change management I facilitated at the IASSIST conference this year. In this post, I look at another example from a different field which brings an aspect of change management to life.
UNESCO has decreed 2019 as the International Year of the Periodic Table (IYPT). It’s the 150th anniversary since Dmitry Mendeleev developed the first periodic table. It grew as additional chemical elements were discovered into the table we know today. Even if people don’t understand what exactly it means, it is recognisable from chemistry lessons at school, it’s had a renaissance on the front of various stationary items and due to the Year of the Periodic table it’s been seen in the form of macramé, breakfast and cookies.
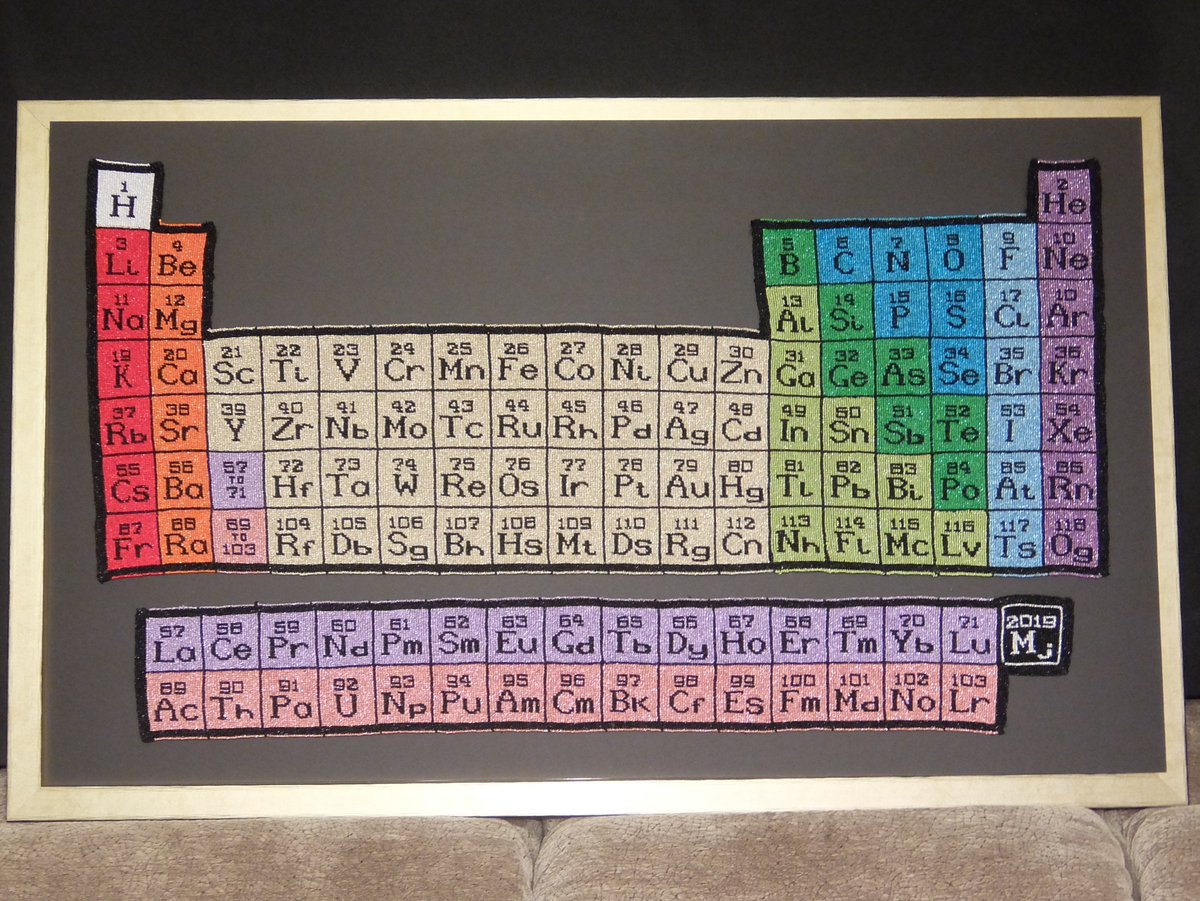
Source: Twitter.
Earlier this year, Professor Sir Martyn Poliakoff and his colleague Dr Sam Tang suggested that the periodic table should be turned upside down.
Presenting a picture of an upside-down periodic table in the workshop sparked a conversation which brought to life the Kübler-Ross stages of grief and an accompanying change curve.
Elisabeth Kübler-Ross developed the curve as a model to describe the grieving process. The model is applied to change management because it’s recognised that there is often a feeling of loss during change. Even if new things are on the horizon, old ones are going and people will need to recognise their loss.
The Kübler-Ross model has five stages.
First there is shock at the change and denial. We look for evidence it isn’t true or won’t happen. Then frustration and anger. These are all quite high energy stages as we fight the change. Then a period of bargaining and self-blame. A stage of ‘if I do this then I can prevent something from happening’. When that energy is used up there will be a period of depression and low mood.
What brings us out of this is experimenting– thinking about the ‘what ifs’ of the new situation. Then we come to a decision on how we will deal with the new situation. Energy is going up, we are feeling more positive. And finally, we incorporate the changes, move on and reach integration and acceptance.
So what happened when I presented an image of an upside down periodic table in the workshop?
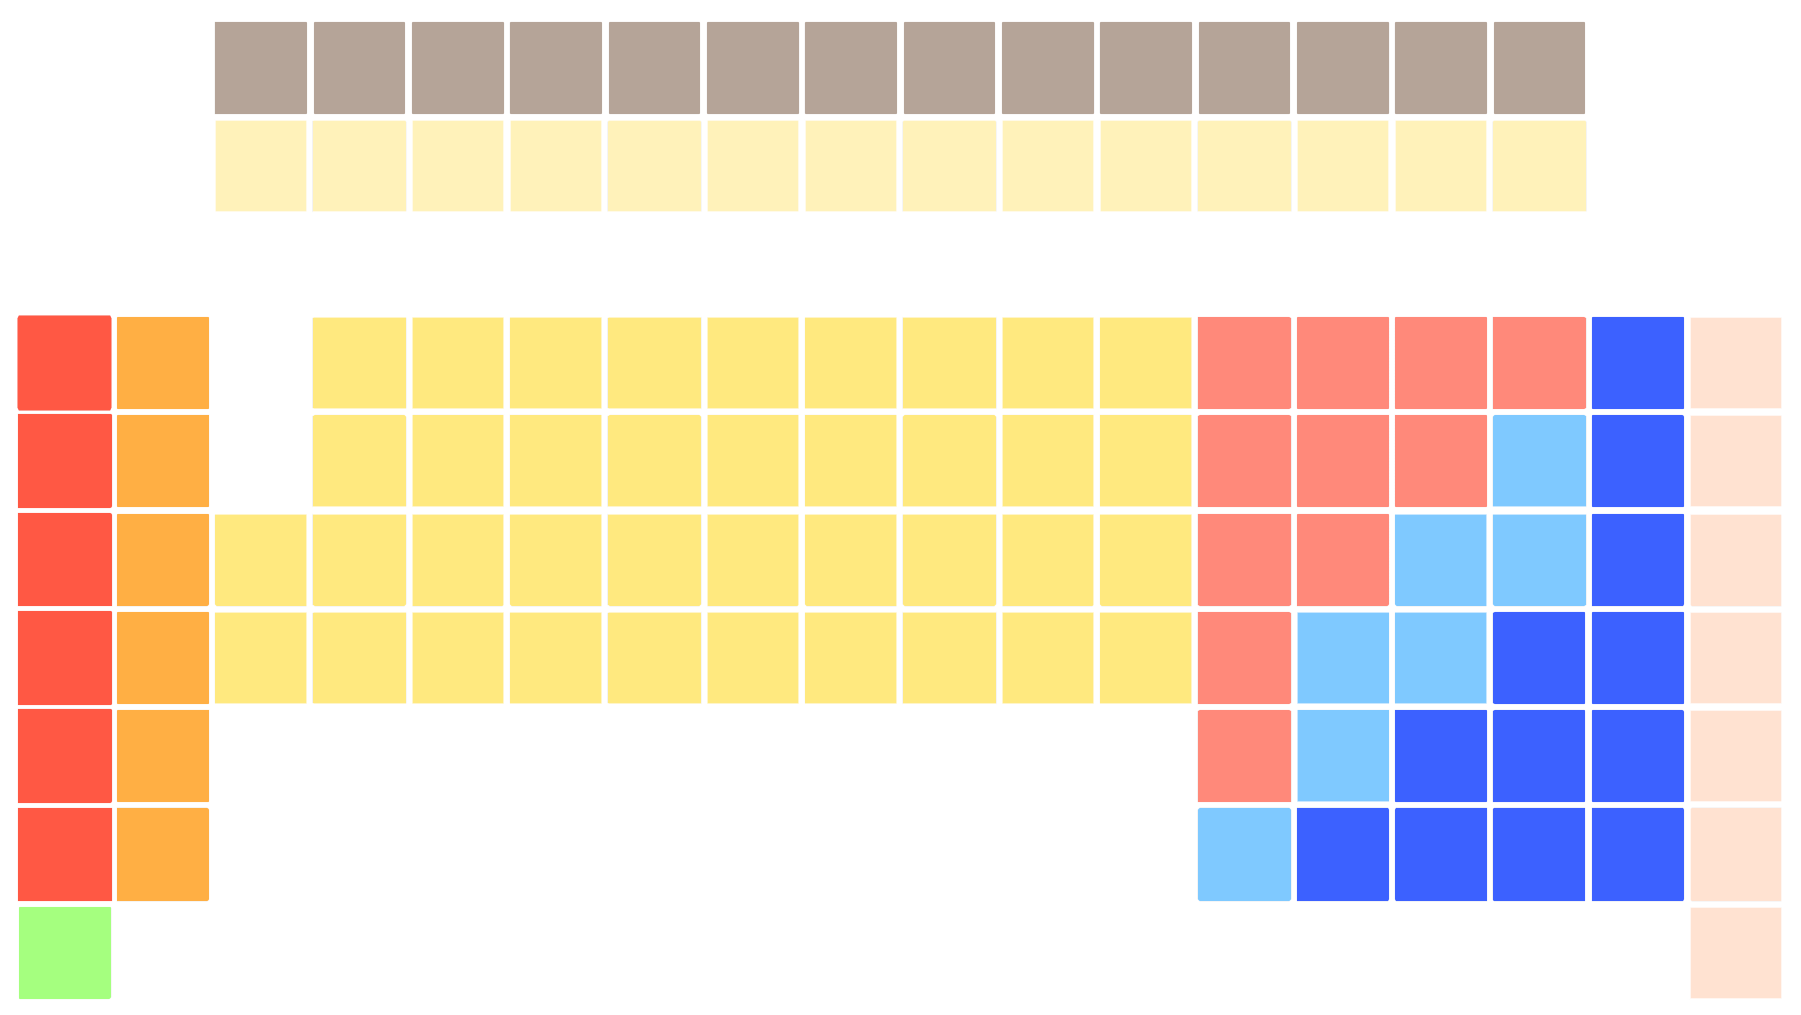
Image: Inverted periodic table, empty of element names.
Well first of all there was the shock of “What is that?” And had I got it upside down by mistake?
Shock and denial
Then comments along the lines of ‘Why would they do that?’ ‘What was the point?’
Frustration (thankfully not too much anger and in this instance not much self-blame either)
Thankfully, we weren’t depressed for too long, but I could feel a dip in energy in the room.
Then the ideas started coming of how this could be a better way of presenting the periodic table. People suggested that maybe the heavier elements were holding the lighter ones down in the table. And this made sense. The energy grew in the room as we decided that upside down it could be useful
Acceptance
We’d gone through the change curve as a group very quickly. I would like to say I had planned this, but I have to admit I hadn’t – it was a moment of serendipity.
The Kübler-Ross change curve can help understand what people are going through.
In real life, a team won’t all go through it at the same speed and very often people may not make it all the way through before more change comes their way. Quite often people will seem to start coming through the other side and fall back or get stuck.
People may be experiencing change in other areas of their lives and that will impact too. Previous periods of change will be relevant, particularly how successful previous outcomes were for people. It’s important to gauge if there was a sense of resolution at the end of previous change programmes, or a sense of things not quite finished.
To say that the rate and amount of change is increasing is a truism, but that doesn’t mean that people find change commonplace or are prepared. Sharing the theory can be very helpful for people going through any change and aid reflection on previous experiences and their own coping strategies.
And if you are wondering what Poliakoff and Tang’s reasoning was for putting the periodic table upside down its that the ‘upside-down’ table is filled up with the simpler elements first from the bottom just as most vessels fill up.
However there doesn’t seem to be much support for this – I guess the scientific community are in the shock or denial stages and look like they staying there.
About the author
Jo Webb is Associate Director at the UK Data Archive with responsibility for business operations and strategy. Jo’s background is previously local and regional government bodies in the field of housing policy and strategy. She’s also an experienced project manager delivering a range of things from houses, computer systems and regeneration of a Victorian area in a seaside town.