 Many people seem to think that cycling in this country is a particularly dangerous thing to do. They may not know that the UK has almost the lowest death rates for car drivers worldwide, so everything else is bound to be higher, as Jenny Mindell explores.
Cycle deaths are so rare that they are given a lot of media coverage. Most people are surprised to learn that on average there are still five people killed on the roads in Great Britain every day. Most of these casualties are car users (46%), pedestrians (25%) or motorcyclists (18%).
But as users of the UK Data Service will understand, what we need to make fair comparisons are rates, not numbers: we need to put the number of people killed (or injured) into context.
But how can we do that?
A UK Minister of Transport famously stated that cycling is much safer here than in The Netherlands; he cited death rates per 1000 population. That of course ignores the fact that cycling accounts for about 2% of commuting trips in the UK but about 25% in the Netherlands!
Colleagues and I have now published four papers where we used the National Travel Survey as the ‘denominator’, the exposure data for which we calculated the death rates.
Death rates by age-group and gender
The first study examined the death rates by age-group and gender for each travel mode in England in 2007-2009.
We were provided with NTS data for how much travel people in each age-sex group in England did per year, for the three years combined. We then looked up the mid-year population estimates for England for each of those years. We added up the number of people in each age-sex group for each year, then multiplied that by the average annual travel to obtain a total number of billion kilometres (bnkm) travelled for each travel mode.
The number of deaths by mode came from ONS mortality data, provided by Public Health England, aggregated over the three years and by age-sex group using the ICD-10 (International Classification of Diseases, 10th iteration) external codes we provided for drivers, pedestrians, and cyclists killed in a crash or fall on a public road.
We calculated the death rate for cyclists, drivers, and pedestrians by dividing the number of deaths for each travel mode by the distance travelled, to obtain deaths per bnkm for each age-sex group for each travel mode. We also tried to look at death rates by time spent travelling. We did not know that time was available in the NTS, so applied the average speed by mode to the distances travelled by mode. This was of course very inaccurate as men generally walk and cycle (and drive?) faster than women; older adults and children walk and cycle more slowly than young and middle-aged adults.
More recently, we updated these figures.
By combining six years of data (2007-2012), we were able to use five-year instead of 10-year age-groups.
Other differences were greater accuracy in the exposure data.
First, we used ‘stage’ data whereas our original study had used ‘trip’ data. Someone who cycles one mile to a bus stop, travels five miles by bus, then walks one mile to their destination would be considered by NTS to have done one mile walking, one mile cycling, and five miles by bus when considering ‘stages’ but would be recorded as travelling seven mile by bus using ‘trip’ data (i.e. the travel mode for the longest stage is used, and the entire journey is ascribed to that mode).
Secondly, we used actual ‘time spent travelling’ by mode for each age-sex group, instead of our all-ages approximation.
We found that although death rates had fallen substantially, we saw the same patterns in 2007-2009 and 2010-2012: death rates were higher in men than women overall and in almost every age-gender-mode group for driving and walking.
Figure 1: Fatality rates by time spent travelling by age, males 2007-12
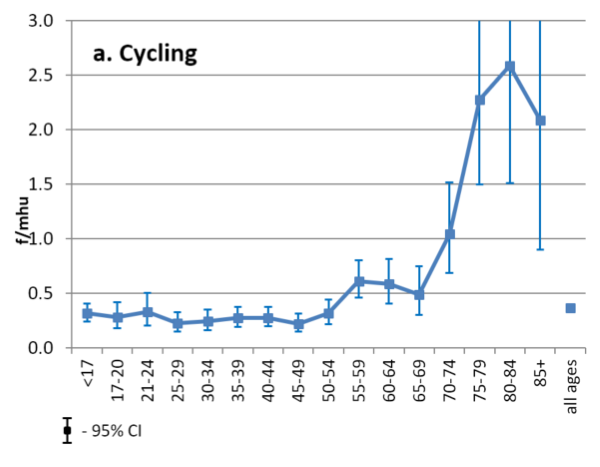
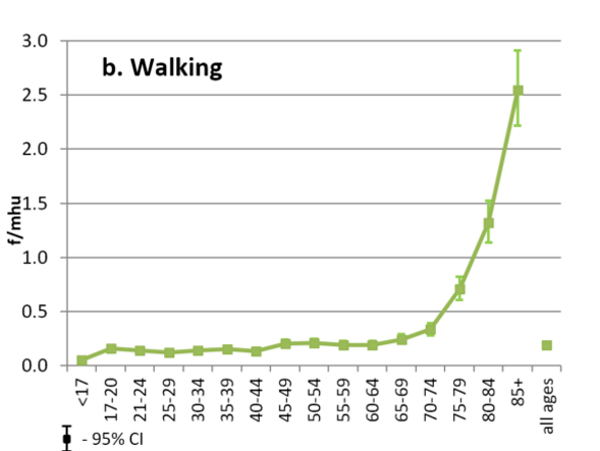
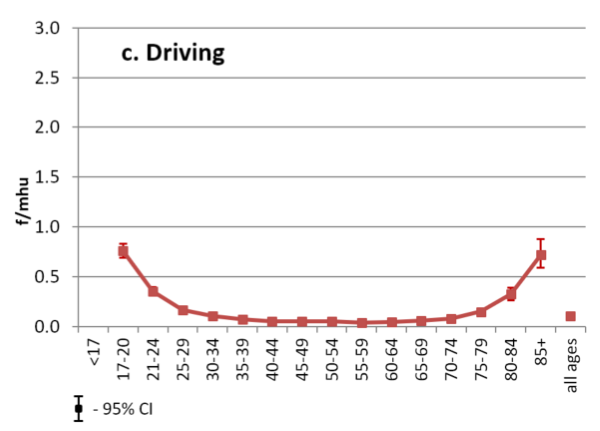
For drivers, the pattern of death rate with age was U-shaped, being highest in young males aged 17-20 and in those aged 80+, whereas it increased exponentially with age for walking and cycling.
Death rates were very similar for walking and cycling, being higher for pedestrians by distance and slightly higher for cyclists by time travelled.
Although death rates were substantially lower for drivers, we could not assess death rates by age and gender on the all-purpose local roads where people walk and cycle.
Death rates for car users are between five and nine times lower on motorways and dual-carriageways, so the true difference by mode, when considering similar people, is probably very small.
Another difference between travel modes is that cyclists and pedestrians seldom kill other road users. For example, 99.4% of pedestrians are fatally injured in a road travel crash are killed by motor vehicles.
My colleague, Shaun Scholes, used police STATS 19 data to study the number of other people killed in fatal road crashes, by the age and gender of the person in charge of the vehicle (driver or cyclist).
Again, we used the NTS data (this time for Great Britain for 2005-2013) as a measure of exposure.
He showed that it is rare for anyone else to die when a cyclist is involved in a fatal crash but more than half those killed in road travel crashes involving a car are travellers other than the car driver.
Fatal head injuries
Our fourth study used the same NTS data to measure exposure but this time, we looked at whether fatal head injuries are as big a problem in cyclists as people working in Accident & Emergency departments sometimes claim.
We used data about the same people included in the study by Feleke et al. but this time, Public Health England provided us with the ‘secondary’ cause of death: the external ICD-10 codes provided information on the cause of the event; these secondary causes were what the medical consequences were, i.e. the medical reason they died.
Even when we combined six years of data and large age-groups, numbers were small so we grouped the causes of death into head injury, multiple injury, and other.
Using the raw numbers, we found that four times as many drivers and five times as many pedestrians died from a head injury as cyclists. Although a higher proportion of cyclists died from a head injury, this represented 46% of fatal injuries in cyclists and 42% in pedestrians; most pedestrians and drivers died of ‘multiple injuries’ which is not coded as the separate injuries themselves.
When we used NTS data as a measure of exposure in people aged 17+ (the legal limit for driving), we found that fatal head injury rates in men were 11/bnkm for cyclists, 23/bnkm for pedestrians and 0.7/bnkm for drivers and 9, 10 and 0.4/bnkm respectively for women.
Using National Travel Survey data has enabled us to combine data on road travel deaths with an accurate measure of exposure – how much people of different ages and gender travel by the different modes.
So, is cycling dangerous?
In 2010-2012, there was one cyclist death for approximately every 50 million km cycled. Although fatal head injury rates per million hours travelled were slightly higher for cyclists than pedestrians, there was one fatal head injury for every 6.25 million hours cycled by men and 10million hours cycled by women in 2005-2013.
A key finding from this use of NTS showed that young males are up to five times safer when they cycle than when they drive – and the rest of us are also safer if they cycle and don’t drive!
© Gail Seres-Woolfson
The National Travel Survey can be accessed through the UK Data Service.
About the author
Dr Jennifer Mindell is Professor of Public Health at UCL, where she conducts research on transport and health, particularly community severance (the barrier effects of busy roads) and road casualty rates. Her main role is leading the UCL team that works with NatCen social Research (as the Joint Health surveys Unit) to run the Health Survey for England, the secondmost downloaded government dataset on the UK Data Service. A public health doctor, she is based in UCL’s Research Department of Epidemiology & Public Health; she is also the Health lead for UCL’s Transport Institute. She is Editor-in-Chief of the Journal of Transport and Health; former Co-chair (Science) of the Transport and Health Study Group and convenor of its Latin American network; and leads for transport and health on the UK Faculty of Public Health’s Health Improvement Committee, which she chairs.