

Dr Ferhat Tura, from Bournemouth University, draws on nine years of the Crime Survey for England and Wales to look at which children are most likely to be victims of crime, and why disabled children in particular need more attention in how we keep children safe.
We tend to think of crime as something that happens to adults. But children are victims too, and when it happens to them the effects can last for years, shaping their health, their schooling, their friendships and, in some cases, their chances of being harmed again later in life.
Despite this, we know surprisingly little about how common crime against children really is in England and Wales, or about which children carry the heaviest burden.
Much of what we did know came from studies that were quite old, looked at only one type of crime at a time, or focused on a single town or county. I wanted a fuller, more up-to-date picture for the country as a whole.
Across two connected studies, my colleagues and I set out to answer two questions. First, how common is crime against children, how has it changed over time, and who is most at risk? Second, what happens when we stop looking at children’s characteristics one at a time, such as their sex or whether they have a disability, and instead look at how those characteristics overlap and affect their victimisation experiences?
Why we used the Crime Survey for England and Wales?
To answer questions like these you need good data, and it has to come from children themselves. That is harder than it sounds. Police records only capture crimes that get reported, and plenty never are. Asking parents can miss things that children have not told them about.
The Crime Survey for England and Wales (CSEW), which we accessed through the UK Data Service, is one of the few sources that asks 10- to 15-year-olds directly about crimes they have experienced in the past year. It is widely regarded as a gold-standard survey. It is nationally representative, it uses the same questions year after year, and it interviews around 3,000 children a year.
That consistency helped us in three ways.
Because the questions do not change, we could pool nine years of data together (2011/12 to 2019/20) and look at how things had shifted over time.
Because the combined sample was large, just over 25,000 children, we had enough cases to study experiences that are, thankfully, rare, such as children who face several different types of crime.
And because the survey is built to represent all children in England and Wales, our findings speak to the whole country rather than one corner of it.
The CSEW is not perfect though, and it is important to be honest about that. It does not cover sexual abuse or violence within the family, it does not capture online harms, and it does not reach children living in care homes or secure settings, some of the very children who may be most at risk.
Our results describe crime that happens to children outside the family, and should be read with that in mind.
What we found
As shown in Table 1, across the nine years, violence was the most common crime children reported (around 6 in every 100), followed by personal theft (around 4 in 100). Household theft and criminal damage were rarer.
About 1 in 100 children were what we call “polyvictims”, meaning they had experienced two or more different types of crime in the same year. When crimes overlapped like this, the most common pairing was violence together with personal theft.
Table 1: How common each type of crime was among 10-15-year-olds, 2011/12-2019/2020
| Victimisation type | Weighted percentage |
|---|---|
| Violence | 5.8 |
| Personal theft | 4.4 |
| Household theft | 1.2 |
| Criminal damage | 1.1 |
| Polyvictimisation | 1.1 |
The more encouraging news is that most types of crime fell over the period, as shown in Figure 1, in line with the wider drop in crime seen across the country.
Figure 1: Trends in crime against children, 2011/12-2019/20
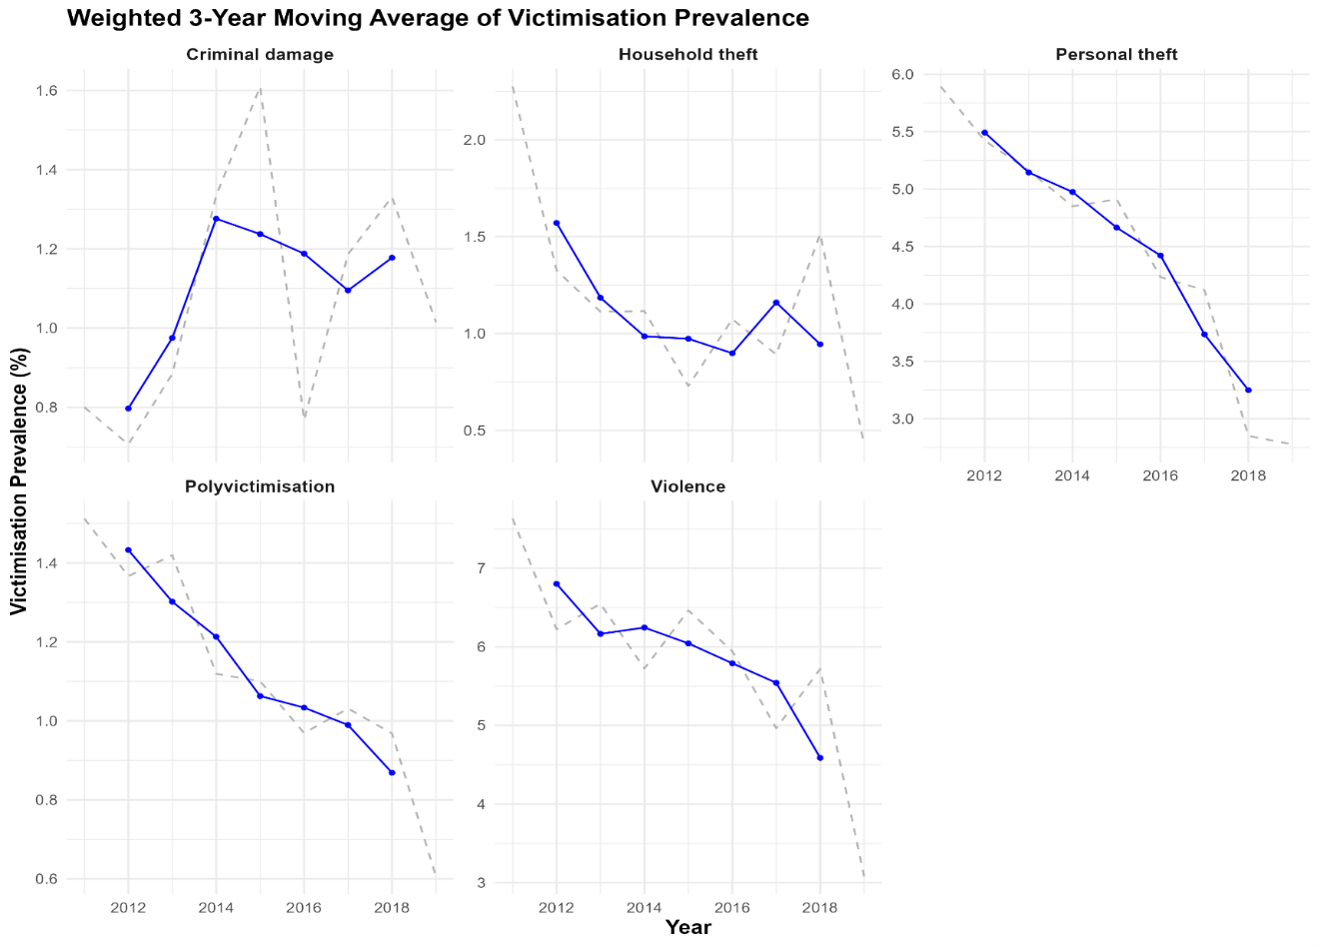
Note: Dashed grey lines show the original yearly prevalence trends for comparison
But the finding that stayed with me is that risk is not shared out evenly. Some children are far more exposed than others.
Disabled children stood out: they were more than twice as likely to face several types of crime than children without a disability. Children living in the most deprived neighbourhoods were also around twice as likely to be polyvictims than those in the least deprived areas. Boys faced higher risks than girls across the board, while some groups, such as Asian children, reported lower rates of violence.
In the second study we pushed this further. Instead of treating each characteristic on its own, we looked at how they combine, for example, being a disabled Black boy aged 10-12, and how that combination affects their violence victimisation risk.
For this we used a newer statistical method called Multilevel Analysis of Individual Heterogeneity and Discriminatory Accuracy (MAIHDA), which is simply a way of estimating risk for lots of overlapping groups at once without the results becoming unreliable.
What we found is worth sitting with. Disabled boys were among the most at-risk children of all: eight of the ten highest-risk groups were made up of disabled boys.
Most of the extra risk came from these characteristics adding up rather than from any single “magic” combination. Put simply, being disabled raises the risk, being a boy raises the risk, and the two stack on top of each other. These effects can be explored in more depth in the paper itself.
What this means for policy
The clearest message is that disabled children, and disabled boys especially, are being overlooked. They are more likely to be harmed, yet they rarely appear as a priority group in safeguarding.
That needs to change. Teachers, social workers, health staff and police could all benefit from training that helps them notice and support these children, and from school policies and reporting routes that actually work for them.
More broadly, our findings show that protecting children is not a job for the criminal justice system alone. Deprivation, housing and family circumstances all shape a child’s risk, which means prevention has to be a shared effort across schools, local services, health and communities.
Reducing crime against children is as much a public health and social justice issue as a policing one.
None of this would have been possible without open, well-kept national data. Being able to reach nine years of the Crime Survey through the UK Data Service is what let us move from guesswork to evidence about which children need protecting most.
About the author
Dr Ferhat Tura is a lecturer and the programme leader of the BA (Hons) Criminology programme at Bournemouth University.
Dr Ferhat Tura uses administrative data (e.g., police recorded crime data, UK Census data, CSEW, UKHLS, OCJS) to investigate mainly victimisation risk (including repeat and polyvictimisation), inequalities in various outcomes (including victimisation, offending, sentencing, and trust in the police), and neighbourhood effects. This project was funded by the British Academy and the Wellcome Trust (Grant number: SRG24\241386).
Comment or question about this blog post?
Please email us!