
 Sean Semple and Linsay Gray have been analysing data on second-hand smoke and discovering that a zero result may not mean what you’d expect!
Firstly, we should confess that we’ve stolen the first (clever) part of this title from an excellent review by Helsel published some years ago in the Annals of Occupational Hygiene. It was on the subject of ‘non-detects’ in science and first got us interested in what we do when our machine or assay spits out a value of ‘zero’.
At face value, it is natural to interpret this as there being ‘nothing in the sample’; no alcohol in your blood, for example.
To the chemist, exposure scientist or instrument technician, however, the zero result is much less black and white. What it actually means is that the instrument wasn’t able to detect what was being looked for: that could mean there was nothing there or it could mean the amount was below what we call the limit of detection or LOD. There is uncertainty in the result. We’ll come back to that…
Our interest is in looking at exposure to second-hand tobacco smoke and several of our team have spent the past decade or more working out how much people exposed to second-hand smoke breathe in at work, in cars, in their home and other settings.
We’ve come a long way in the UK since Scotland first introduced a ban on smoking in enclosed public places back in 2006 and we’ve subsequently spent much of our research time looking at these changes and seeing how we can further drive down the proportion of the population exposed to second-hand smoke.
One of the great sources of data on Scotland’s health is the Scottish Health Survey that asks a range of questions and collects some biological samples from cross-sections of the Scottish population in most years since 1998.
Among the measurements taken are concentrations of cotinine in saliva which provide a gauge of how much nicotine a person has taken in to their body in the past couple of days. All these (anonymised) data are freely available via the UK Data Service and it was to them we turned with a view to looking at salivary cotinine going back over the past 20 years.
As non-smokers’ salivary cotinine data have such a skewed exponential distribution, their averages are generally reported as a Geometric Means (rather than arithmetic means) within the annual Scottish Health Survey report.
A geometric mean for a sample of n individuals is calculated by multiplying all their values and taking the nth root. However, there was an absence of information on the trend over this period and we were keen to know if there had been a change in the proportion of non-smokers who had ‘zero’ exposure to second-hand smoke.
The results were fascinating.
Exposure to second-hand smoke had indeed fallen as expected when the 2006 smoking ban was implemented. However, what was also important was that there had been continuing reductions in recent years as the message that smoking indoors and at home and causing others to breathe your cigarette smoke was no longer socially acceptable. This was good evidence that targeted campaigns such as ‘Take it Right Outside’ were having the desired effect.
But what really caught our eye was that the proportion of non-smoking adults with ‘zero’ exposure had increased from one in eight in 1998 to more than four out of every five adults by 2016 (Figure 1); reminding us of the review on how scientists should handle ‘non-detects’.
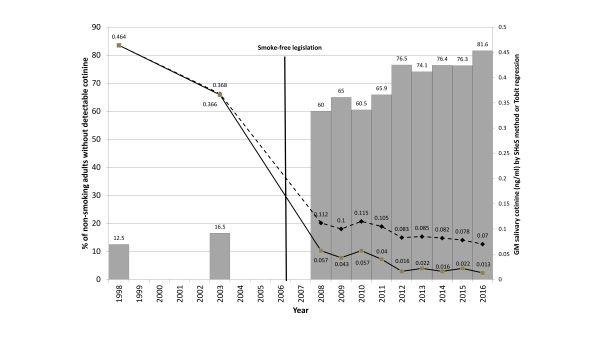
Figure 1.
The traditional way of calculating a Geometric Mean (or average) when you have some zero values in your data is to replace them with a ‘made-up value’ that lets you calculate a geometric mean. Typically, this new value is simply a value half-way between zero and the limit of detection of your device or assay (LOD/2). Some use LOD/(square root of 2) but it is essentially the same idea – you assign a fixed value to any measurement that came out as ‘zero’. The review by Helsel in 2010 had concluded that this method is probably OK when the number of non-detects makes up a small proportion of the overall number of samples but it becomes unreliable and can over-estimate the average when non-detects make up a third or more of your population.
Clearly by 2008 we were seeing more than 50% of the adult non-smoking population having a ‘zero’ salivary cotinine sample (Figure 1) and so we had to look at improved statistical methods to calculate the average.
Our team looked at a new method called Tobit Regression which essentially extrapolates from the distribution of all the ‘non-zero’ values to calculate a regression for the samples that had values lying between zero and the LOD. We applied this new analysis to the dataset and found that improved Geometric Mean estimates were considerably lower than had been reported since 2008.
In addition to being able to report that the proportion of non-smokers who had measurable evidence of exposure to cigarette smoke had fallen from 87.5% to 18.4% we were also able to report the scale of reduction in non-smoking adults’ exposure to second-hand smoke between 1998 and 2016: – a whopping 97%.
We consider both of these measures of population exposure to be useful metrics of a country’s progress towards a healthier working and living environment and wanted to make this call to the public health community. In Scotland, we have a government aim of having a tobacco-free generation by 2034 with less than 5% of the population smoking – and we see the value of having transitional targets such as 90% of non-smoking adults with no detectable cotinine by 2022 and 95% by 2030.
We published our results in the BMJ journal ‘Tobacco Control’ and the paper attracted considerable attention worldwide, being picked up by over 40 news outlets and tweeted to a combined following of >40,000 across the globe. We have had discussions with the Scottish Government Tobacco Control Team about the use of these data and we look to the method being incorporated into future reporting of the Scottish Health Survey.
So, much ado about next to nothing? Or an interesting use of existing data to see how it can be best used to check on policy effects and call for further government action in public health? We hope it is the latter and that this blog makes you think before calculating a ‘simple’ Geometric Mean in the future!
Edit, June 2019:
Since writing this blog post, the authors have worked with the UK Data Service to produce a case study: Assessing progress in protecting non-smokers from secondhand smoke
About the author
Dr Sean Semple is an Associate Professor at the Institute for Social Marketing at the University of Stirling. He is interested in human exposure science with particular emphasis on the health effects of indoor air pollution, tobacco control research, and occupational epidemiology. His translational research work is focused on air quality measurement and interventions relating to second-hand smoke, biomass fuel smoke and workplace inhalation hazards.
Dr Linsay Gray is a Senior Investigator Scientist from the MRC/CSO Social and Public Health Sciences Unit at the University of Glasgow, co-leading a programme on enhancing survey and other data sources. Linsay has specific interest and expertise in the development of statistical methodology for addressing bias induced by non-participation in population-based studies. A focus is on the measurement of prevalence and trends in health behaviours – especially alcohol consumption, smoking and e-cigarette use.