 What does the National Travel Survey tell us about road injuries? How does self-reporting of injuries differ from police-reported data?
Rachel Aldred explores how the National Travel Survey can usefully add to the official statistics on risks and injuries to pedestrians and cyclists.
Active travel, such as walking and cycling, are widely recognised for both their health and environmental benefits. Scotland has developed its National Walking Strategy, Manchester’s Cycling and Walking Commissioner (Chris Boardman) has put forward a Made to Move strategy and Transport for London has developed the Healthy Streets for London approach.
Although there has been analysis of risks and injuries to pedestrians and cyclists, this for the most part uses police or hospital figures. However, it is known that most injuries don’t get treated in hospital or reported to police, and this was something Rachel set out to address.
The data
Sources traditionally used for analysis injury risk are police injury data (Stats19 Road Safety Data) and hospital data on injuries (Hospital Episode Statistics). Rachel examined data from the National Travel Survey secure dataset from 2007-15 to ascertain whether this could supplement the official statistics, by including many more (self-reported) injuries, and enabling additional demographic analyses.
The National Travel Survey (NTS) is a rolling, cross-sectional survey of around 14,000 individuals each year, consisting of interviews and a seven-day travel diary. The NTS covered Britain during 2007-12 and England only from 2013 onwards.
Respondents to the NTS can report incidents which happened on ‘a public road, including pavements and cycle lanes […] even if no other party were involved’ over both the previous year and previous three years. This means that the data even includes pedestrian falls, not covered by police road injury data.
The NTS data does not record incident location or date, making it hard to match to police or hospital statistics. It does however include information on whether another road user was involved. The NTS data also includes information on:
- injury or treatment
- police involvement
- travel mode used
The findings
Based on the responses given to the National Travel Survey, the number of injured during incidents in the previous year was derivable: 2474 people – 1.7% of the full sample.
Comparing the results with injuries reported in the police Stats19 data suggest five times more self-report injuries than are recorded by the police, roughly in line with a quarter of National Travel Survey incidents having involved the police being present.
When considering ‘vulnerable’ groups of road users (i.e. cyclists and pedestrians), Rachel discovered that incidents involving injury are disproportionately higher than for other road users in the past three years and even more so when looking only at the previous year.
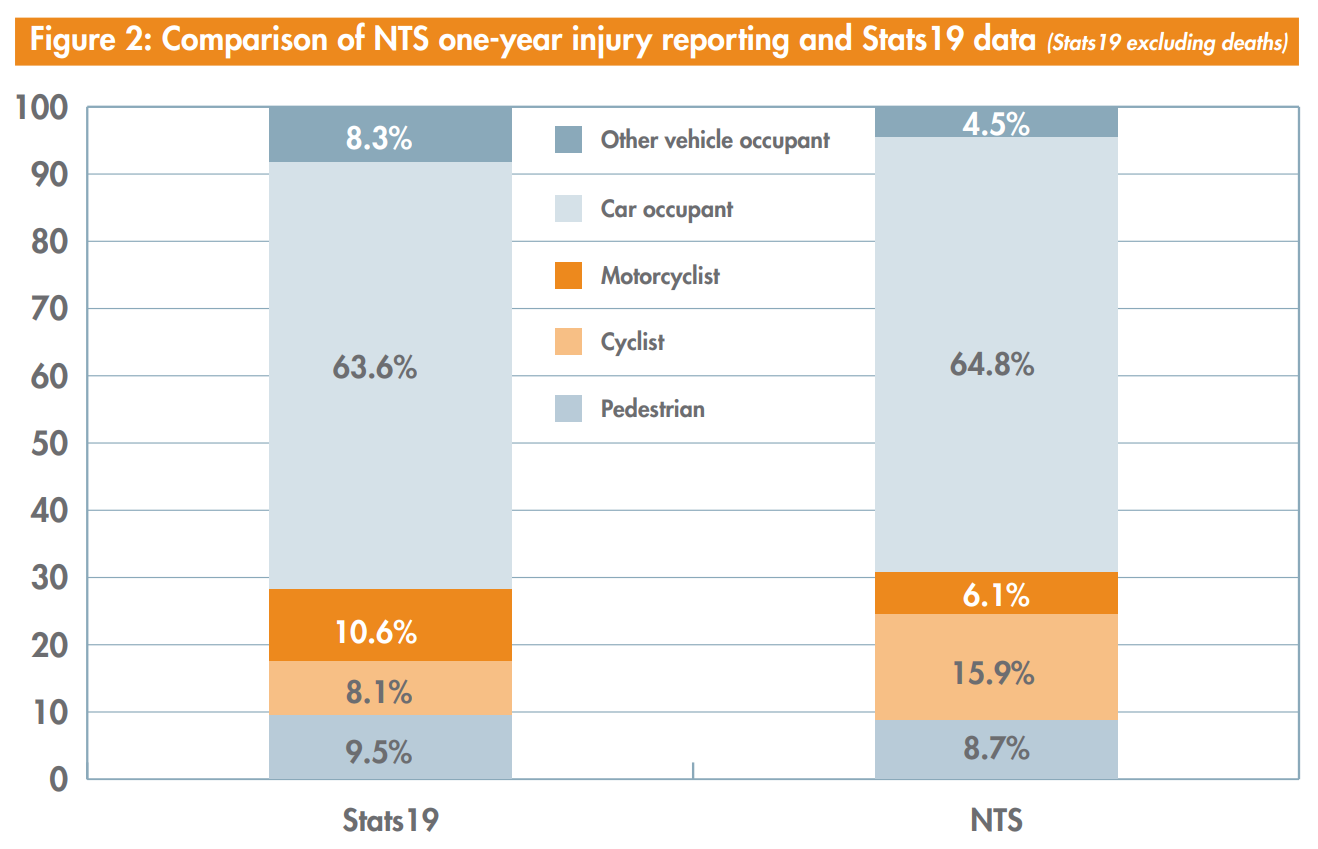
A particularly large number of slight injuries to cyclists are not reported to the police. This might help account for perceptions of cycling as a risky activity. The graph below shows that in police injury data, 8% of injured people were cycling. But in the NTS data, this rises to 16% of those injured during the past year.

Figure 2 Comparison of NTS one-year injury reporting and Stats19 data (Stats19 data excluding deaths)
Larger version | Accessible version
Rachel’s analysis of the data also identified areas of inequality in injury risks. She was able to calculate this both relative to population size, but importantly also in relation to travel distance, as NTS is a travel survey. This means that she could adjust for the amount of walking that different demographic groups do in looking at their injury risk.
She found that women were more likely than men to be injured either by motor vehicles or falls. Over half of those reporting a fall were aged 70 or over. Another notable inequality group is disabled pedestrians who were five times per kilometre walked more likely to be injured as a result of a collision with a motor vehicle and six times more likely to be injured in a fall. Other groups at high risk of being injured by a motor vehicle were people in lower-income households or those living in London.
The impact
Rachel provided evidence to Parliamentary Select Committees including:
- the House of Commons Select Committee on Transport Road Safety Inquiry
- the House of Commons Transport Committee, Oral evidence on Active travel, Monday 17 December 2018 (particularly Q16, Q19, Q20)
Rachel’s research has informed the Local Implementation Plans for London boroughs as part of their implementation of the Mayor of London’s Transport Strategy.
A report on the research was launched at a stakeholder event. Living Streets and Sustrans contributed to the report foreword and have helped publicise the work.
Living Streets cited analysis from the research in their Response to the call for evidence: Cycling and Walking Investment Strategy Safety Review.
Rachel Aldred said:
“Motor vehicles cause many more injuries than are recorded by police or hospitals. They put vulnerable pedestrians – many with few other options than to walk – at high risk. There is also a very high unreported toll of injuries to cyclists. While the data doesn’t tell us why these inequalities exist, it does suggest transport planning doesn’t do enough to protect the most vulnerable road users.”
The UK Data Service impact team has worked with Rachel on a case study giving more detail of her research, how the data was analysed and the impact of her work.
About the author
Dr Rachel Aldred, Reader in Transport and Director of the Active Travel Academy at the University of Westminster focuses on active travel in her research, with an interest in enabling behaviour change and a shift in transport mode to walking and cycling. She researches injury risk, including perceptions of safety and risk; near misses and unreported injuries. She uses datasets including police injury data (Stats19 Road Safety Data) and the National Travel Survey. She often walks, cycles, and uses public transport.