
Lucy Goodfellow, Research Assistant at the London School of Hygiene and Tropical Medicine, discusses the impact of socio-economic health inequalities and age during the COVID-19 pandemic.
People living in more deprived areas of England were hit harder by the COVID-19 pandemic in many ways, including higher risk of income and job losses and larger negative impacts of school closures. They were also much more likely to be hospitalised or die from COVID-19 infection. It’s complicated to determine exactly why this is, as so many important factors that might affect infectious disease burden vary by socio-economic status. Older people are more likely to develop severe COVID-19, but it’s important to consider people’s vulnerability to severe disease at all ages, which can depend on underlying health conditions.
Understanding why and how these inequalities occur is key to being able to prevent the most disadvantaged people from being the most vulnerable to another pandemic, or to the seasonal viruses that spread every winter. Using mathematical modelling allows us to consider hypothetical scenarios and isolate the factors we are most interested in. Data on age structure in different areas is available at very detailed levels, and Census 2021 collected which we can separate by age.
Socio-economic health inequalities
Census respondents were asked to rate their health out of the categories ‘Very Good’, ‘Good’, ‘Fair’, ‘Bad’, and ‘Very Bad’. To easily compare different populations’ self-reported health, we calculated the proportion of people in ‘Very good’ or ‘Good’ health and called this ‘health prevalence’. Health prevalence therefore ranges from 1, in a population where everyone perceives themselves as in ‘Very Good’ or ‘Good’ health, to 0 if no one does. This is also how healthy life expectancy, which is used to summarise health across our whole lives, is calculated.
When we looked at how health prevalence varies by age and relative deprivation, we found that at all ages people living in more deprived areas, measured by the Index of Multiple Deprivation (IMD), are less likely to be in good health. For example, less than half of people aged between 65 and 69 living in the most deprived 10% of areas reported living in ‘Very good’ or ‘Good’ health, compared to 80% of those in the least deprived decile. People living in the most deprived decile experience the same health prevalence at age 40-44 as those in the least deprived decile do at age 70-74. All of these inequalities follow a gradient: the greater the relative deprivation, the greater one’s probability of being in ill-health.
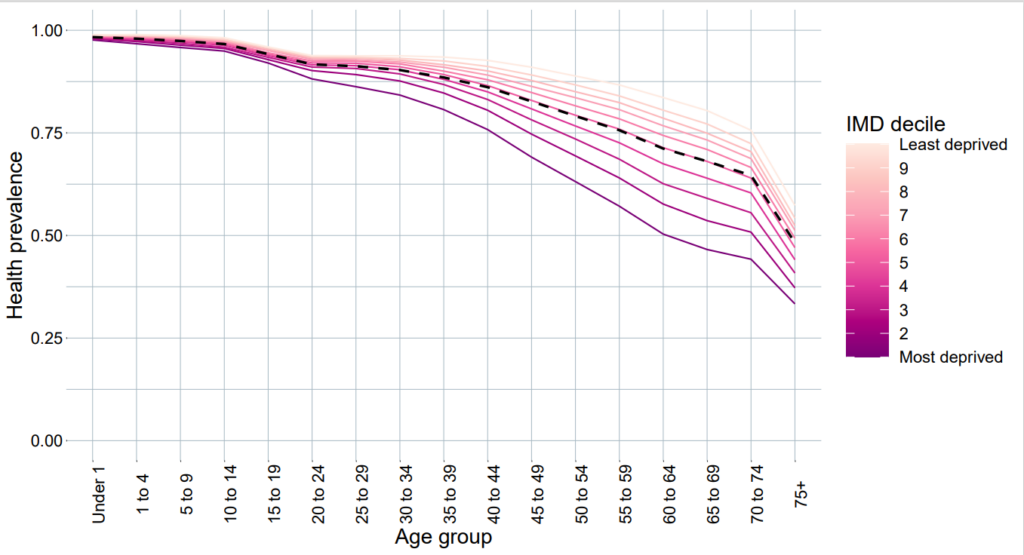
Figure 1: Health prevalence in each age group and IMD decile, calculated using Census 2021 data. Black dashed line shows average age-specific health prevalence across the whole country.
How this impacts COVID-19
The likelihood that someone experiences clinical COVID-19 (symptomatic infection which may cause someone to seek care) when infected depends on their age. Older people are more likely to develop clinical COVID-19, which is likely due to our health getting worse as we get older. We wanted to explore the impact of more people of being in ill-health in more deprived areas of the country, as well as at older ages.
We used the Census data on self-reported health to incorporate local-level deprivation into the probability of clinical infection, by comparing populations’ health to the average health in each age group across the whole country. Essentially, since someone in their early forties living in one of the most deprived areas of England experiences the same health prevalence as the average person in their late fifties (see Figure 1), we assumed that they were also as likely to develop clinical COVID-19 as the average person in their late fifties. This is a simplistic version of what’s actually going on, but it allows us to investigate the potential impacts of the wide health inequalities in England.
Age structure
As well as affecting our likelihood of developing severe COVID-19, our age also changes our risk of exposure to viruses. The number of people we meet with each day, and their age, depends on how old we are. Younger people, especially those aged between 5 and 20, tend to interact with the most people each day, particularly at school and through socialising. This is important to consider when looking into infectious disease transmission, as younger people therefore transmit viruses quicker.
Age structure varies by relative local-level deprivation (more deprived areas tend to have younger populations), and also depends on whether an area is urban or rural. This is probably due to age-specific migration such as retirement-age movement to rural areas and labour-age movement into urban areas. We therefore included the age structure of each population in our model, and adjusted transmission to account for social contact patterns.
Our analysis
We used the well-established mathematical model known as an SIR model (where people move between ‘Susceptible’, ‘Infected’, and ‘Recovered’ categories), which tracked a population as SARS-CoV-2 was transmitted between individuals. In our model, we split up people who were infected into clinical and subclinical infections, where the probability of developing a clinical infection was calculated using the health prevalence from the Census data. We looked at how epidemics differed in populations which had the health prevalence and age structure of each IMD decile, in urban and rural areas.
Our results
In urban areas, the most deprived decile experienced 9% more infections and a 97% larger clinical peak (which describes the worst-case scenario hospitals would have to deal with) than the most affluent decile; the corresponding figures in rural areas were 7% and 91%. The number of deaths predicted by this model depended a lot on the age structure of populations, as younger people were assumed to be less likely to die. When we age-standardised these results, people living in more deprived areas consistently faced higher mortality rates.
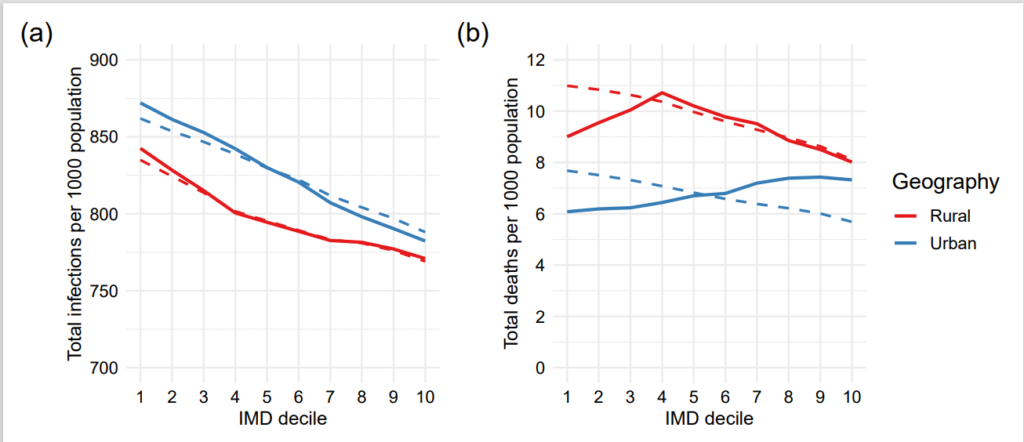
Figure 2: Crude (solid lines) and age-standardised (dashed lines) outcomes in each IMD decile, where 1 is the most deprived decile and 10 the least deprived, in urban and rural geographies. (a) Total infections, (b) total deaths, both per 1,000 population.
We also used our model to calculate that 21% of predicted clinical cases and 16% of deaths would be avoided if everyone in the country had the same health as the most affluent 10% (3.8 million clinical cases, over 65,000 deaths). These health-attributable deaths were happening at all ages – between ages 30-70, more than one in five deaths would be avoided if everyone had the same underlying health as most affluent.
More to consider
This study only considers a simplified version of socio-economic inequalities in the COVID-19 pandemic. In reality, we’ve likely underestimated the effect of underlying health and age in the pandemic. We didn’t take how people’s behaviour changed in lockdown into account, when many people living in the most deprived areas had less control over their mobility and were more likely to be in key-worker employment. We didn’t consider socio-economic disparities in vaccine uptake, which would exacerbate these inequalities.
We should also consider who is being affected by these inequalities. For example, for all broad ethnic groups other than White, a disproportionate percentage live in the more deprived half of the country. All of these inequalities therefore disproportionately affect people of non-White ethnicities.
Implications
Many complicated factors combined to produce inequalities in the impact of COVID-19. Models which inform policy need to incorporate socio-economic factors and acknowledge that exposure and risk are not equally distributed around the country. More data and research are needed to understand how and why these inequalities are being sustained.
Without change, people living in the most deprived areas of England will continue to bear the brunt of infectious diseases each winter, and whenever the next pandemic happens.
Committing to improving health in deprived areas and reducing avoidable health inequalities is urgent – even before the pandemic, life expectancy had stopped rising and inequalities were widening [12]. Through this study, we have shown that improving health equality will also reduce inequalities in the impact of infectious diseases. The recommendations made by Health Equity in England: The Marmot Review 10 Years On, including improving standards of living, creating fair employment, and developing healthy communities, would reduce avoidable inequalities in health and by extension avoidable inequalities in epidemics.
This blog post is based on research which you can read here.
About the author
Lucy Goodfellow is a Research Assistant at the London School of Hygiene and Tropical Medicine, within the Centre for Mathematical Modelling of Infectious Diseases. She focuses on using mathematical and statistical methods to study how population-level differences produce and sustain inequalities through infectious diseases, and is interested in developing mathematical methodology to approach these questions.