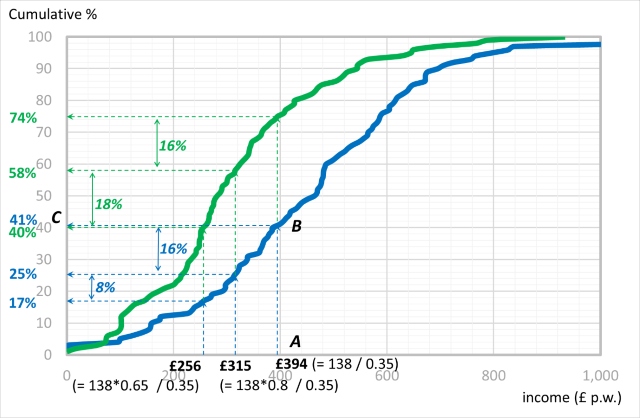
Drawing on the Family Resources Survey (FRS) and other datasets, Chihiro Udagawa estimates and compares income distributions of single people in independent households and those in a house in multiple occupation in Birmingham.
By transforming Family Resources Survey datasets to represent Birmingham’s households coupled with data from the 2011 Census, Annual Survey of Hours & Earnings, Average Weekly Earnings and the Bank of England interest rate data, I estimated the distributions of single people in independent households and single people in a house of multiple occupation (HMO) in Birmingham according to their incomes as of March 2018.
The examined single people were privately renting young people (aged 16 to 34 years) in employment and the examined income was that net of income-related benefits (notably Housing Benefit or Universal Credit).
The estimated income distributions showed that around 40% of single people in independent households had a weekly income below £394 – the minimum level required to afford the median private rent of a one-bedroom (non-sharing) property in Birmingham (£138), given a rent-to-income ratio should be 0.35 at most.
Three quarters of single people in HMOs fell in the income cohort – i.e., the great majority of sharers were unlikely to afford living alone in the private renting market.
The estimates could be applied to the local housing planning – for example, in assessing the target size of Affordable Rent, which is a social rent for those able to afford higher (albeit not as high as private) rents.
Given that Affordable Rent is set at 80% of the median private rent, it would target single people with an income of £315 to £394 (again, on the same rent-to-income assumption). According to the income distributions, around 16% of single people in both independent households and HMOs would fall in the range.
If Affordable Rent were to be lowered to 65% of the private rent, which broadens the target income range from £256 to £394 range, a further 8% of single people in independent households would be attracted. The HMO equivalent would be 18%, suggesting the lower Affordable Rent might impact single people in HMOs more greatly.
The similar estimates (and nowcasts/projections with appropriate inflationary adjustments) for other localities or household types could be of immense benefit to local housing planners, in particular, those who need a feasible market study for their new housing products.

Income distribution curves for single people in independent households (blue) and single people in Houses of Multiple Occupation (green)
- The estimated results can be shown as an income distribution curve as in the above chart.
- The horizontal axis of the chart represents a weekly household income, and the vertical axis represents the cumulative percentage of singles whose income is up to the specified level.
- The interpretation and the analytical process of the chart is, for example, as follow:
- On the horizontal axis, A is the point which represents the minimum income required to rent a one-bedroom property (£394).
- On the IND singles’ income distribution curve, B is corresponding to A.
- On the vertical axis, C (41%) is corresponding to B.
- This provide 59% (= 100-41) of IND single would be able to afford the rent.
This research supports those who are uncovering affordability issues in housing for younger people in the UK, such as the Institute for Fiscal Studies, reported on by such as the BBC.
Data from the Family Resources Survey, 2011 Census and Annual Survey of Hours & Earnings are available from the UK Data Service.
Chihiro Udagawa is a Research Associate at Cambridge Centre for Housing & Planning Research, Department of Land Economy, University of Cambridge. He has been studying UK housing economics, household finance and mortgage market with quantitative and econometric approaches. His research interest includes, among others, housing affordability for first time buyers at local housing market, youth renters’ financial behaviours and impact of bank of mom & dad on first time buyers.
