 Ana Morales-Gomez explores the ways that data from the UK Data Service collection can be used with students in the classroom.
Today’s young people have grown up surrounded by unprecedented amounts of information, which is sometimes hard to sift through. Although overwhelming at first glance, this presents an opportunity for everyone involved in the teaching/learning process.
On the one hand, students have experience using electronic devices from a young age, which gives them plenty of confidence in terms of hardware and software usage, but does not necessarily equate to advanced information-seeking and/or processing skills.
On the other hand, educators have extensive experience in summarising, discriminating and communicating information, ideas and concepts; the combination of the strengths of both sides of the teaching/learning process is what makes the use of online resources and technology a powerful tool.
The UK Data Service is committed to making data more accessible for all members of society. We do this by providing access and training to a broad collection of data from national surveys, census and international organisations to academic researchers and everyone who has the desire to do so.
We believe that schools can largely benefit from the use of real-world data, as it can provide up-to-date information that can be tailored to suit diverse learning objectives.
Example activities
Here are three example activities using data held by the UK Data Service that we believe can boost student engagement and participation, as well as provide meaningful insight about contemporary issues in our society. These resources are designed for teachers to be used in the classroom to complement the teaching curriculum in those areas.
How well do you know Britain?
A practical activity designed to help students to understand the country we live in and its people. We quiz students on topics such as: demographics, housing, health and social attitudes. This is followed by a presentation about how to find and use social science data, including how to present data in charts, tables, etc.
A secondary aim of this activity is to highlight the difference between students’ (and by extension society’s) pre-conceived beliefs and the picture of reality that data can provide.
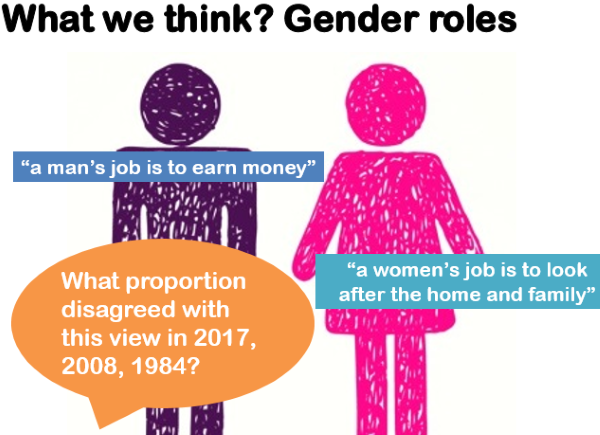
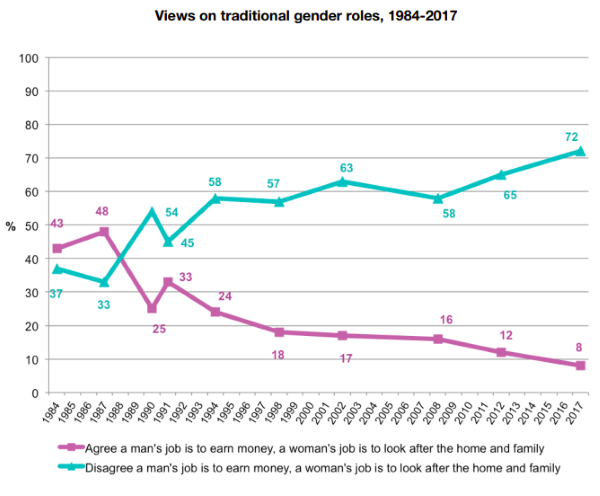
From the British Social Attitudes Report
Phillips, D., Curtice, J., Phillips, M. and Perry, J. (eds.) (2018), British Social Attitudes: The 35th Report, London: The National Centre for Social Research, available: https://www.bsa.natcen.ac.uk/media/39284/bsa35_full-report.pdf
A picture of crime
This activity seeks to promote a discussion on the reasons why and how the social world changes, focusing on an ever-relevant topic in society, i.e. crime. Using real data, students will have the opportunity to examine crime trends over time and the emergence of new forms of crime.
Elements that can be discussed in class also include how society needs to adapt to change, using the example of cybercrime and how new legislation needs to define new forms of crime to allow effective prosecution of them.
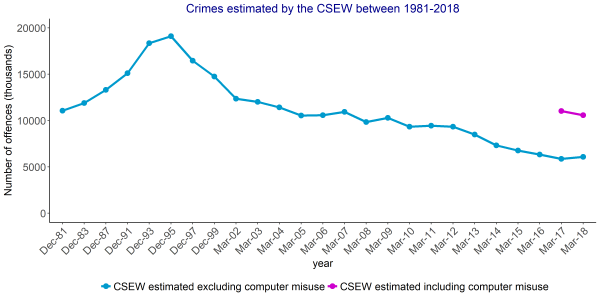
Source: Office for National Statistics – Crime Survey for England and Wales.
How do you compare to the population?
An activity designed to guide students to explore the social world around them. Researchers are constantly looking for new ways of capturing information about the world around us. Social scientists focus their attention on human behaviour, interactions, perceptions, attitudes, etc., searching for explanations for the good and the bad indicators with the purpose of fostering progressive social change. Surveys are one of the prime examples for the way in which social scientists attempt to understand our ever-changing society.
This activity aims to provide basic statistical notions and tools to explore social surveys, such as averages, variation, representativeness and bias.
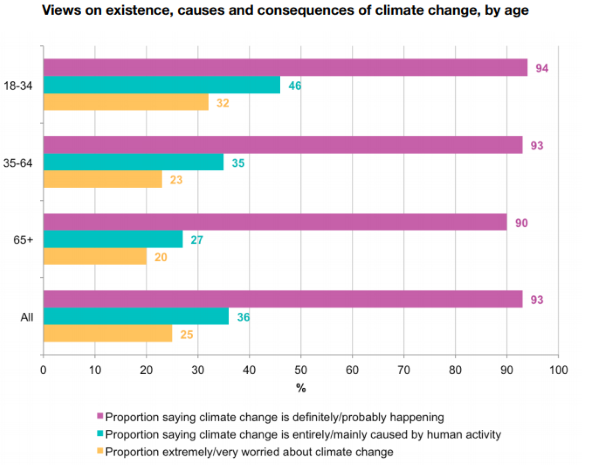
From the British Social Attitudes Report
Phillips, D., Curtice, J., Phillips, M. and Perry, J. (eds.) (2018), British Social Attitudes: The 35th Report, London: The National Centre for Social Research, available: https://www.bsa.natcen.ac.uk/media/39284/bsa35_full-report.pdf
Developing future ideas. Can you help?
We believe these resources (available here) can ignite your students’ curiosity about data. We will continue to work on ideas to make data accessible and useful at all levels. Until then, enjoy engaging in discussions about data with your students and keep your eyes peeled for new updates on resources for schools.
If you are not a fan of waiting and you have an idea you want to share with us, please drop us an email and we will see if we can make it happen.
About the author
Ana Morales-Gomez is a Research Associate in the UK Data Service User Support and Training team at the Cathie Marsh Institute, University of Manchester. She holds a PhD in Social Statistics from the University of Manchester. Her research interests revolve around the use of quantitative data for understanding inequalities in social phenomena, such as crime and reoffending, health outcomes and child development.