 As part of our blog series on the 2021/2021 UK censuses, Rihab Dahab introduces us to census microdata, explores how it is useful to researchers and the expertise the UK Data Service has in this area.
Why do we run censuses?
When the first UK census took place in 1801, it was an exercise for counting the population. Therefore, it only measured how many people were living in the country and their location at that time.
However, officials over time realised that the census could serve a purpose greater than just counting people. So, more information about the population was gradually included in the census such as demographic characteristics, socioeconomic and health-related data.
Nowadays, in addition to the original purpose of the census ‘counting the population’, the UK censuses are employed to obtain characteristics of the population that help the government in decision making and planning.
For example, if you want to provide more services such as new schools or hospitals, it is important to know where these facilities should be built and who will benefit from these services. Census data can provide these answers. Because census data is collected from everybody in the country, census outputs can be produced at a very small geography level, which is very useful if we want to identify where we need to provide more services.
In terms of what census is for, it informs public decisions and public spending, so things like local government grants from central government depend on findings derived from the census.
Census data are also used as a basis for many other statistical products. For example, if you design your own survey, you may use information from the census to design your survey sample and decide upon your sample size. The census is also used by Non-Government Organisations (NGO) and for research purposes which in turn informs public policy.
What are census microdata?
Census microdata are one of the four main census outputs along with aggregate, boundary and flow census data.
But what, you ask, are census microdata?
They are datasets consisting of random samples of anonymised individual records from individuals and households from the UK censuses. The main unit of observation is the individual and the responses of each individual to the different census questions are recorded separately in different variables.
For a person who is not familiar with these statistical terms I would say- census microdata are samples of census records. These types of data are very flexible, they have various socio-economic details, but the data are anonymised to protect the confidentiality of the census respondents.
Similarly to the other census outputs, census microdata are produced by three separate census agencies:
- the Office for National Statistics (ONS) produces the data for England and Wales
- National Records for Scotland (NRS) produces the data for Scotland
- the Northern Ireland Statistics and Research Agency (NIRS) produces the Northern Ireland data
As the UK census is collected in coordination between these three agencies, we should expect that there are differences between the censuses in the three countries. This is obviously due to social differences, for example in the religious affiliation questions. However, we are lucky that great effort has been made to make these censuses as harmonised as possible as it is very useful to produce data at UK level.
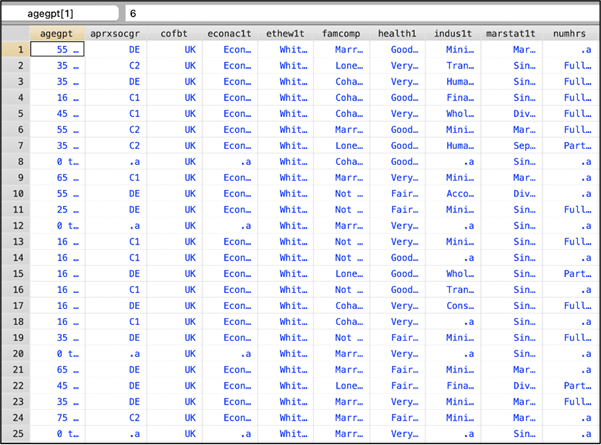
Image: A snapshot of the 2011 Census Microdata Teaching File for England and Wales in Stata (source: UK Data Service)
The history of CMI in the development of census microdata
We are grateful to Cathie Marsh!
Thanks to her influential research that she carried out in the 80s about how to produce anonymised records, the Government made the decision to disseminate the Samples of Anonymised Records (SARs) from the 1991 UK Census (at that time SARs was synonymous with census microdata) and, for that purpose, Cathie established the Census Microdata Unit in the University of Manchester in 1992.
Unfortunately, Cathie passed away just months later (in the beginning of 1993) before witnessing the success of the unit she founded.
As a recognition of Cathie’s leading role in census microdata research, the Cathie Marsh Centre for Census and Survey Research (CCSR) was established in 1995. In 2014, the CCSR was merged with another reputable research centre in Social Sciences at The University of Manchester ‘The Institute for Social Change’ forming the Cathie Marsh Institute for Social Research (CMI), which is a leading centre for excellence in quantitative social science. The Institute provides a focal point at The University of Manchester for the application of quantitative methods in interdisciplinary social science research.
Why use census microdata?
As I mentioned earlier, census microdata are flexible as they are at the individual level.
They look just like survey data and can be used in similar ways. This is one of the main characteristics of census microdata, which make them easy to use and manipulate.
You can create your own tables with these types of data, you can combine different variables to make new data from them and they allow you to define your own subsamples. You can also carry out different types of statistical analysis using these sorts of data, regression analysis, multivariate analysis, or multilevel modelling, for example.
Another key characteristic of census microdata is their large sample sizes. For example, the 2011-Open data have a 1% sample of individuals. The sample size of the 2011-Safeguarded data are 5% sample of cases in each file (Regional and Local authority). The 2011-Secure data have larger sample sizes, the files are based on 10% samples. Moreover, because the data were collected in different years, you can also study changes over time using census microdata.
However, because census microdata are sample data we must remember that estimates derived from them are subject to sample errors. But often if you have a huge sample size (as in census microdata) the sample error is not going to be a big issue. Also, these data do not have detailed geographical variables because they have socioeconomic detail.
It is important to emphasise that although the data is anonymised, adding more detailed geographical variables to a data may increase the risk of data disclosure.
Usage and impact of census microdata
The files of census microdata include a fairly wide range of topics, covering demographics, household and socioeconomic aspects. The census microdata are used in academic research, student dissertations and report writing in non-academic sectors.
A very recent work that was carried out using the 2001 and 2011 census microdata examines how borough-level differences and time trends of cycling in London vary by cyclists’ demographic characteristics, socioeconomic status and local geographic location. The study, which was conducted by Martin, Morciano and Suhrcke also investigates how differences in the investment in cycle infrastructure explain patterns and trends of cycle commuting.
Analysis of the socio-demographic characteristics of cyclists shows that men in 2011 were more likely to cycle (5.6%) compared to women (2.7%).
Cycling was more common among:
- the White British group (5.8%) relative to the other ethnic minorities (3.0%)
- younger commuters relative to commuters belong to the older age group (5.5 % for aged 30–39 vs 1.7 % for aged 60–64)
- individuals with short-distance commute (5.9 % if 20 km)
With regards to the prevalence of cycling, the analysis shows that; across all boroughs and in both years, cycling was more concentrated among commuters who belong to the higher socioeconomic status group. The analysis also reports that the overall investment on cycling was equivalent to £2.12 per capita per year with greater investment in Inner London than Outer London (£2.78 per capita per year vs. £1.76 per capita per year).
Because the researchers used a large representative sample with a full set of variables (317,117 commuters, including 11,199 cyclists), they were able to perform several multivariate regression analyses in order to assess the differences in the prevalence of cycling among boroughs before and after adjusting for individual level and area level characteristics. The findings show large differences in cycling prevalence between boroughs without and with accounting for individual level and area level characteristics in both years.
When assessing the association between individual level characteristics and the prevalence of cycling after controlling for borough level and all individual level characteristics, large differences in cycling prevalence in both years were found with cycling less prevalence among cyclists with:
- the longest distance to work (>20 km) relative to cyclists with shorter distance to work (<5 km)
- ethnic minority groups (Indian, Pakistani, Bangladesh, other Asian, other Black, African, Chinese and other ethnic groups) compared to White British
- women compared to men
Assessment of the association between infrastructure spending and change in the prevalence of cycling at the borough-level shows positive association with and without controlling for borough-level population changes. The model predicts that if the annual spending on cycling were increased from £2.12 to £7.00 or £15.00 per capita over ten years, cycling in London would have increased by 2.89 or 3.54 percentage points instead of the reported 1.74 points.
What does the census microdata support team bring to the UK Data Service?
The Census microdata support team in the UK Data Service, based at the Cathie Marsh Institute at the University of Manchester, is willing to answer any query raised by census users about data or resources via our dedicated helpdesk.
Questions are handled by experts most able to provide the answers to the questions our users ask.
We also very much value our users’ suggestions, comments, or feedback that help us to further improve. It is worth mentioning here that the UK Data Service’s dedicated helpdesk team is also available to answer all users queries about the other types of data and resources that the service provides.
And to our users who do not have the time to go in person to training sessions or conferences (when the good old days are back!), we have a set of interesting webinars and online workshops that cut down travel time to zero, which you can join them from your homes or offices.
We tailor our webinars and online workshops to suit the needs of students, researchers and other professionals from non-academic sectors.
Recently, Patty Doran presented an online workshop about ‘Accessing and analysing census microdata using Nesstar’. This workshop was the third in a series of three free online workshops aimed at showing our users the key tools of accessing and analysing census aggregate data, flow data and microdata from the UK Data Service.
The workshop included a presentation, demo of how to access census data from the UK Data Service platform, and exercises followed by discussion. The participants were given worksheets and they used our free online tool Nesstar to complete the activities.
After the workshop participants gained knowledge about the different census microdata available from the UK Data Service and learned how to access them. They were also able to understand how to explore online census microdata and carry out basic analysis using the online exploration tool Nesstar and learned how to download census microdata on to their machine.
About the author
Rihab Dahab is a Research Associate at the University of Manchester and a member of the census microdata team for the UK Data Service (Cathie Marsh Institute for Social Research). Rihab develops training to support researchers and census microdata users from non-academic sectors. Her research focuses on the influence of armed conflict on children undernourishment, and using multilevel modelling to address research question.