 Ben Brindle, a PhD student at the University of Brighton and one of our #DataImpactFellows, discusses what he learnt on the UK Data Service’s Safe Researcher training course recently.
The UK Data Service provides research access to wide array of datasets covering all manner of topics. For my PhD research, which looks at the labour market effect of immigration to the UK, I decided that it would be optimal to use some of the UK Data Service’s secure datasets, including the Secure Labour Force Survey and the Annual Respondent’s Database.
In order to gain access to these datasets I was required to attend a one-day Safe Researcher training course recently. In this post, I share some insights from the course.
Safe outputs
As you may have guessed, ‘secure’ datasets are classified as such because they contain sensitive information and a high level of detail – on health conditions or financial data, for example – and thus presents a risk of re-identification of firms, individuals etc. This means that research outputs must be checked to mitigate this risk of potential disclosure
One way in which outputs may be disclosive is if they have small counts of one or two people.
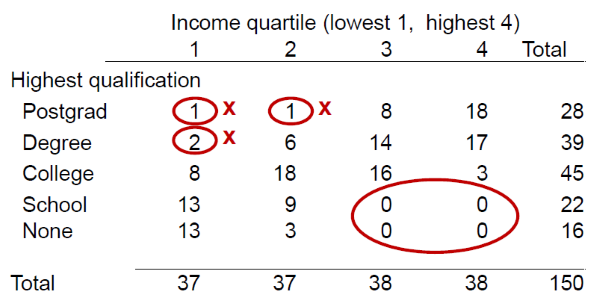
Take the income and education tabulation below, for example. If one of those respondents in the first or second income quartiles with an undergraduate or postgraduate degree were to look at the top-left of the table, it is very likely that they would be able to identify themselves in the data. Individuals may also be able to identify themselves when summary statistics – minima and maxima, for instance – relate to a low number of observations.
Whether the reporting of zero values represents a disclosive output is not as clear-cut.
Going back to the income-education tab, it tells me that somebody whose highest level of education was GCSEs is in the two lower income quartiles. Tables such as this, reporting zero values, can be reveal sensitive information about groups (‘class disclosure’), but whether this is the case or not depends on the context. Sometimes zeroes are ‘logical’ and reveal nothing problematic. For example, if a table revealed that no bankers suffered occupational health problems due to toxic agents, this would present no issue, as it is logical given their profession.
It is one thing to know where issues can arise and another to address these issues.
Luckily, the UK Data Service suggested a number of possible solutions:
- Cell suppression, where the cells containing small counts are blanked.
- Rounding of the offending cells (to an appropriate level).
- Changing the format of the results, to ratios or growth rates for example.
- Redesigning the output.
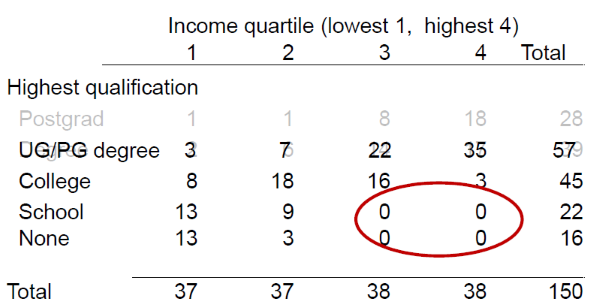
The latter solution is likely to avoid disclosure issues without losing too much detail and therefore is often used. Going back to the income-education tabulation, this could involve the merging of the undergraduate and postgraduate categories, as in the table below, thus reducing the risk of disclosure somewhat.
However, the zero values remain a potential problem (depending on the context) and would have to be tackled in some manner.
Controlling the outputs
Given how important it is that outputs are not disclosive, the UK Data Service has a number of measures to ensure that secure data remains protected, the most significant of which is to limit access to secure data to within the Secure Lab.
The Secure Lab is a secure remote working environment (no points for guessing that!) which contains a range of software, from Word and Excel to Stata and R, that can be used by researchers to conduct their analysis and write up their results.
When outputs are at a “publishable quality” – that is, written up for publication or presentation – they have to go through a process called Statistical Disclosure Control (SDC), or ‘output clearance’, before they are released to the researcher. Requested tables, graphs, maps, or whatever else, are thoroughly checked to ensure that they are not disclosive.
When it comes to small counts, for example, the UK Data Service – like most UK Research Data Centres – has a threshold of 10 – as opposed to the theoretical threshold of three suggested in the above table – to help reduce the risk of re-identification.
Safe researchers
However, while UK Data Service can restrict the outputs released to ensure that sensitive information isn’t made public, they cannot prevent this on their own – Secure Lab users need to ensure they are safe researchers!
Central to this are positive attitudes; if researchers have a positive attitude towards data safety then this will lead to positive behaviours when it comes to using these data.
Some of the most problematic things researchers could do is to:
- Share data with somebody who has not been approved to work on the project, even if it’s just a couple of figures.
If the other person hasn’t gone through the safe researcher process then they are not aware of potential disclosure risks and are in breach of both procedures and the legislation. - Use data for a purpose it wasn’t approved for.
Researchers are granted access to Secure Lab data for a specific purpose only, and that project will be deemed ‘safe’ (i.e. it will have a valid statistical purpose). Using it for a different purpose is, again, a breach. - Write down information from the screen.
To do this is to remove data from the secure environment where it’s no longer protected, and thus bypass the security model
The most important thing, however, is to contact the UK Data Service when unsure if something is a disclosure risk or not. That’s exactly what the team is there for, to support researchers!
What have I learnt?
The course provides an important reminder to researchers about the importance of safe data access and the different processes and procedures that are in place to protect survey respondents, data holders, researchers etc.
It’s important that we adhere to these procedures as doing so allows us access to these data which we can use to produce illuminating research that shines a light on what is going on in the world around us!
About the author
Ben Brindle is one of the UK Data Service Data Impact Fellows 2019 and is in the second year of his economics PhD at the University of Brighton’s Business School.
His research, which is funded by the ESRC’s South Coast DTP, examines how the labour market responds to immigration-induced supply shocks; through either technology mix changes, where firms alter their production techniques or output mix changes, where firms that use the abundant labour type intensively grow in size. To do this, he uses the Quarterly Labour Force Survey and the Annual Respondent’s Database.