
Rob Dymond-Green (Technical Co-ordinator for the Census Support Service) at the UK Data Service discusses new ways of presenting the Service’s data collections.
We’ve been thinking about ways to highlight the depth and breadth of the data we hold, to demonstrate its geographical spread – from Australia to Greenland and the time scale it covers – from c400 to the present day. We also hope to appeal to people who wish to explore, find and use data in a range of different ways. One route to presenting the data collection was a geographical representation and I’ve been playing around with some alternative approaches to our Discover interface. Discover is a search engine that sits on top of our catalogue and allows you to type in your query and to pick categories to filter the results. Presenting our collection with reference to the time of the data collection and the location it refers to, can, we hope, help to bring the data alive and demonstrate – powerfully – that these data represent people’s lives and experiences.

The map above shows where in the world we have data. I used a heat intensity map to show the concentration of studies per country.
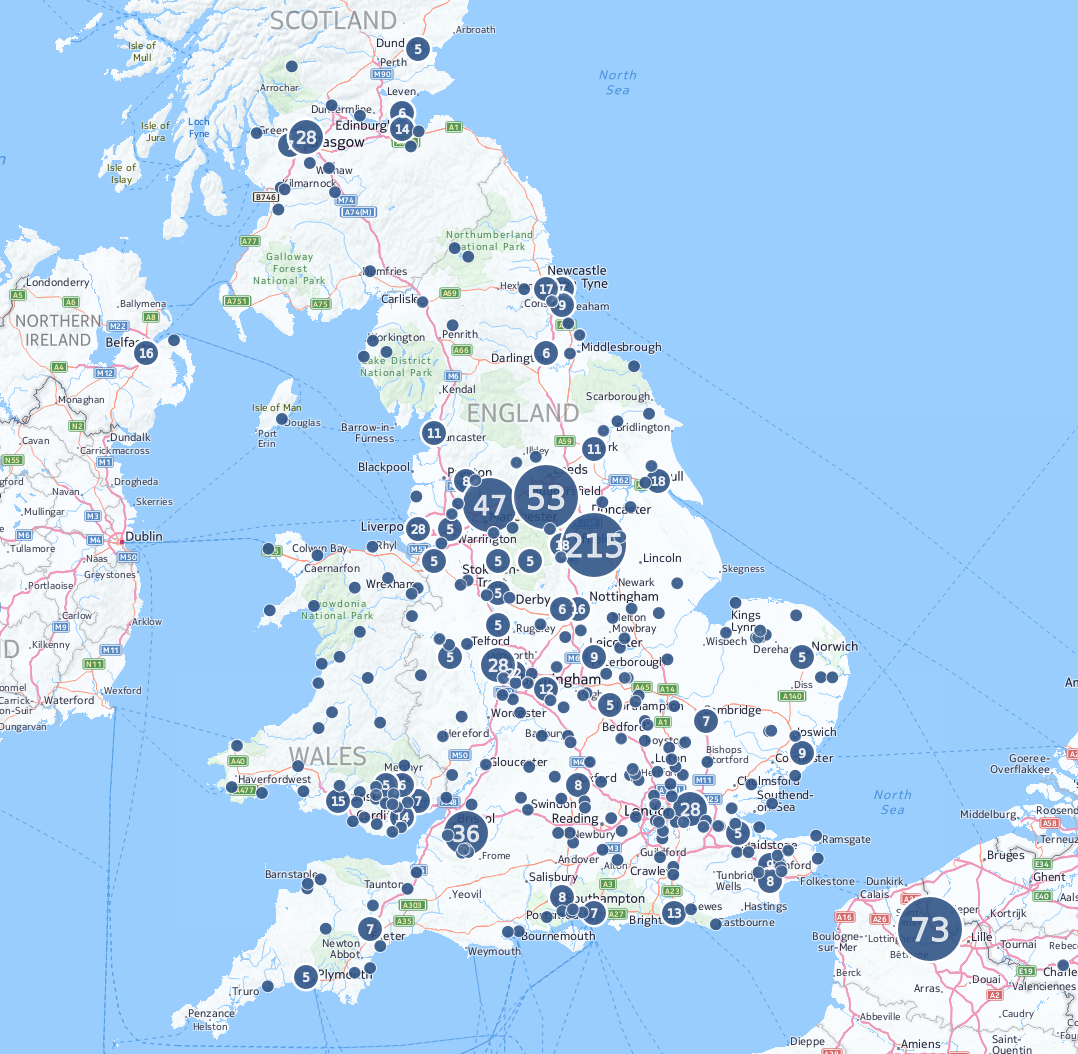
This map shows the number of studies per location, on the whole this visualisation worked well, but it did highlight an issue with geocoding the location information from the study records. An example of this is that the data catalogue contains about 200 studies for Wales the country, but the geocoding process put the location as Wales in a village near Sheffield; the method I used to extract the data from the public Open Archives Initiative Application Program Interface (OAI API) lost the some of the contextual information as it pulled the data out into a set of data tables. When viewing the record on our website, the information tells you that the data coverage is Europe and that it contains countries England, Wales and Germany, but to the automatic geocoding process it was presented with addresses that state Europe or England or Wales or Germany, without the contextual information to geocode to a country rather than to a place.
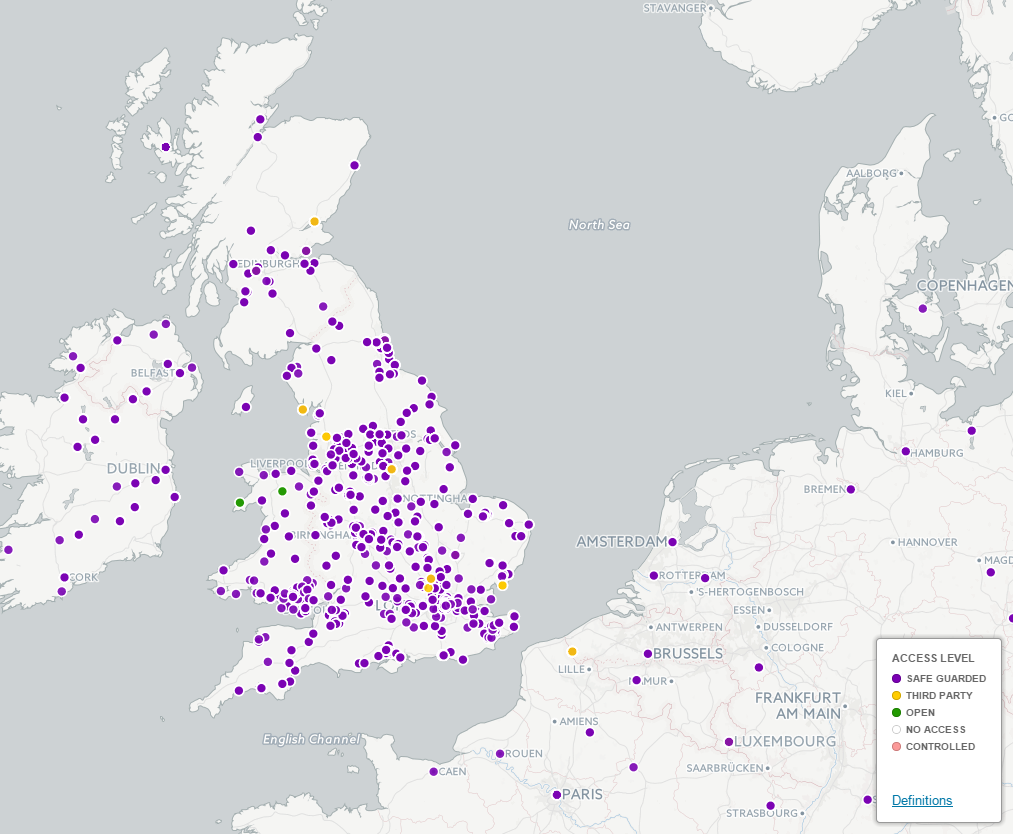
Another area I wanted to explore was a way to highlight the access conditions of each study. Our access conditions cover the open data we hold to data, which are controlled access because they contain personal data or are covered by specific licence conditions. This map shows all the studies, but each study is colour coded by the access level of the data. I thought this map worked quite well, you are able to click on a data collection and the caption that appears contains a link to the record in Discover. We discovered a limitation, however, where if multiple studies geocoded to the same point the user can only click on the first data collection presented. A work-around for this could be to offset each data collection a little, creating cluster points at that location. An alternative would be to display a table below the map which could display all the data collections for that location.
All the maps I’ve produced are purely proof of concept, but we are planning on incorporating some of these ideas to enhance the user experience of our website with our Innovation Fund partners Audiencenet, who are consulting widely with people across a range of sectors on the user experience of our website.