Justin Hayes, Census Support Service Manager at the UK Data Service updates us on the fascinating 1961 Census digitisation project.
We are delighted to report our progress on our pioneering ‘statistical archaeology’ project to retrieve information from the 1961 Census Small Area Statistics (SAS) from a large set of digital images, and make it available for digital analysis, using current software tools, for the first time.
The project is being developed in partnership with the Office for National Statistics, the UK Data Service and the University of Salford. We are retrieving data and metadata from aggregate statistical outputs from the 1961 Census contained in a set of approximately 141,807 digital images of tabular data taken from the microfilm and printed volumes in which it has been reposing, unavailable and unused, for over 50 years. None of the data are disclosive and we’ll deploy statistical disclosure control before they are made available in full.
The 1961 SAS were produced as part of the aggregate statistical outputs from the 1961 Census. They contain more detailed information about population characteristics for a much larger number of much smaller areas than the main published outputs, the County Reports and Topic Reports, which are available as series of printed volumes in major libraries. The 1961 SAS, however, were only produced and supplied on request, mainly to local authorities and universities, and were never published or made available beyond the original microfilm supply media to organisations that purchased them.
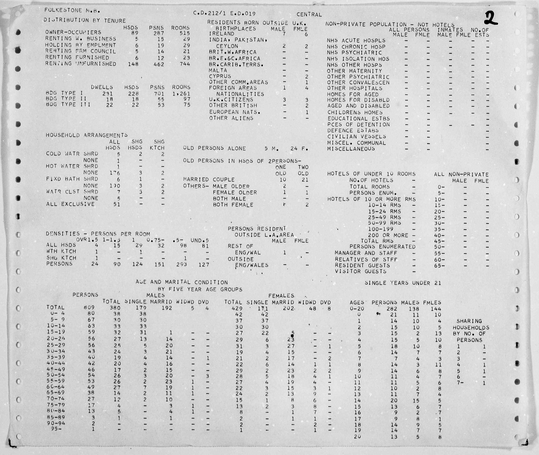
Image containing data for an enumeration district in Folkestone arranged in a number of populated data tables
The image set currently available to the project contains fairly comprehensive geographical coverage of information across England and Wales at district level, good coverage at ward level with some gaps, and enumeration district data for all EDs in London, but very little elsewhere. There are tantalising glimpses of ED level outputs outside London being used in analyses in a few publications, so it seems that they must have been produced. We suspect that if they are still in existence, it will be on the original microfilm cassettes hidden away in local authority and university archives. If you are aware of any 1961 Census SAS data held by your local authority, or any other (1966 sample census?) similar data on microfilm, please contact us to discuss the potential for inclusion in our processing of the 1961 SAS.
Aggregate outputs from the UK’s decennial censuses are currently available in digitally usable form back to 1971 via Web interfaces including our own InFuse and Casweb. This project is extending the availability of 1961 census aggregate data to provide detailed and comparable socio-economic data from the beginning of the 1960’s, a period of profound social change, of great interest to researchers and policy makers interested in population change over time.
The project employs innovative optical character recognition (OCR), quality assurance and data management techniques to extract, combine and structure the statistical information contained in the images into a unified dataset that will make it available for digital analyses using modern software tools for the first time. Project partners, the PRImA (Pattern Recognition & Image Analysis Lab) at the University of Salford have extended their Aletheia tool (a document analysis, recognition and annotation system) to lift the data from the census volumes and we have developed a templating function that enables automated extraction of numeric values with attached metadata (meaning) from the images. Individual number recognition rates of over 97% are being achieved, removing the high-cost of ‘eyeball’ OCR. To date Aletheia has mainly been deployed on written/ typed text rather than data/tabular-type artefacts. It’s massively more efficient, quick and cost-effective. It also learns as it goes.
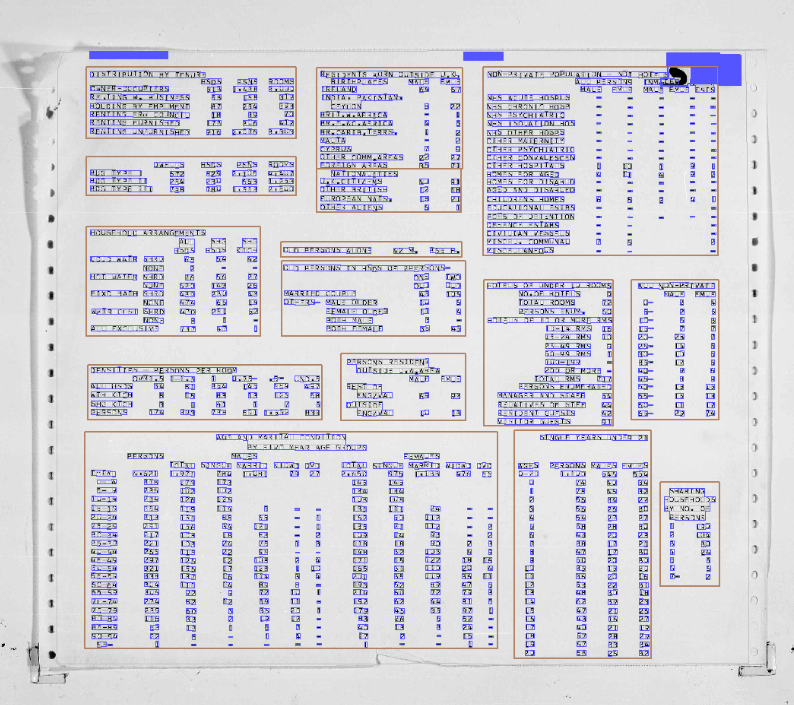
Image with template overlay
Professor Apostolos Antonacopoulos, who leads the PRImA Research Lab at University of Salford said: “We recognise the interesting nature and technical challenges of the project, as well as the greater good that will come from having more useful data for research.”
The UK Data Service Census Support team at Jisc has developed a comprehensive and robust quality assurance process based on internal logic within the data involving comparisons of groups of values that should have equivalent values (e.g. ‘all people’ should equal ‘all males’ + ‘all females’). Outputs from the OCR processes are taken through millions of comparisons to identify and rank numbers that don’t ‘fit’ with their surroundings and require correction.
We are creating robust statistical data, structured with their metadata – we take the data from their original source media through to a robust data quality assured linked dataset using robust standards, for people to make use of the data for modern digital analyses using software tools.
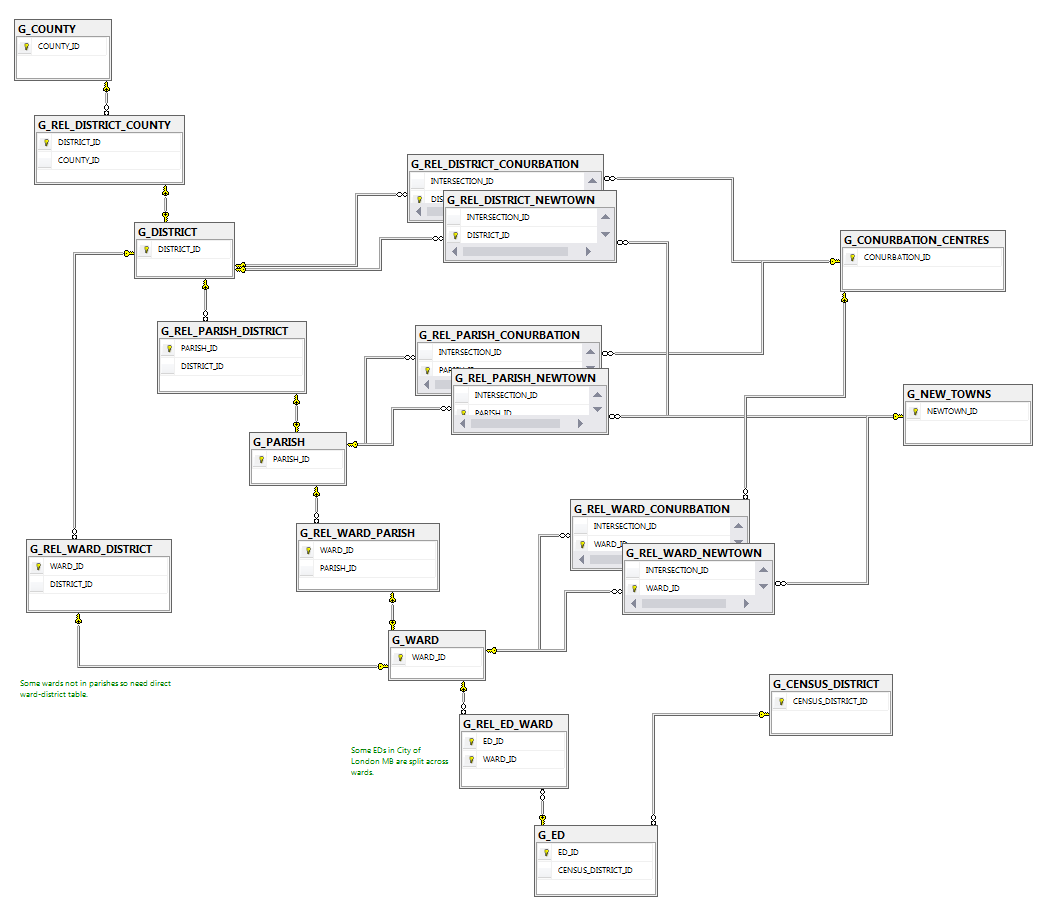
Database diagram of geography types described in the data and the relationships between them
Our statistical archaeology project is focusing initially on digitising seven London Boroughs, starting with Hammersmith and Lewisham, followed by Battersea, Camberwell, Deptford, Fulham and Lambeth.
The ONS has supported two phases of feasibility and process-development work on the project over the past 12 months. Outputs have exceeded expectations, and ONS has requested a more substantial proposal for the comprehensive processing of the all information in the image dataset, which is being developed. All the outputs will be available to all under Open Government License. We eventually hope to enable the linking and search of census aggregate data from 1961 -2011 (and on to 2021!)
With our high success rate so far, we are developing a crowd-sourced correction interface created using the Zooniverse platform, currently being tested, for the remaining 3%. It presents small snippets of images focused on individual, highlighted values to enable rapid corrections which will feed back into the QA process. (Watch this space for more news about our Zooniverse platform!)
The potential for statistical archaeology and getting the data off the artefact is unlimited, so if you have recent census data on microfilm or in printed volumes, or know of any other data locked in printed or ‘at risk’ formats, please get in touch.