
As part of a suite of articles on big data, Szymon Walkowiak, who worked with us as a data scientist, writes about the capabilities of R for researchers who wish to process and analyse big data.
R, the open-source data analysis environment and programming language, allows users to conduct a number of tasks that are essential for the effective processing and analysis of big data. One of the advantages of R is that it facilitates data management processes such as transformations, subsetting and “cleaning”, and helps users in carry out exploratory data analysis and prepare the data for statistical testing. R also contains numerous ready-to-use machine learning and statistical modelling algorithms which allow users to create reproducible research and develop data products.
R has grown in popularity over past few years due to its unrivalled statistical capabilities and its active community of users. Although the rise of big data temporarily threatened this growth —R traditionally struggled with large data sets because of its memory limitations—R is now one of the 20 most popular general purpose programming languages (according to the TIOBE Programming Community Index 2014). It is also the most favoured analytical tool, along with Python and SQL, by data science recruiters (for more information visit KDnuggets). Recent developments of new R packages and big data open-source projects like Apache Hadoop and Cloud computing – for example, Microsoft Azure or Amazon Web Services – have made it possible to manage, analyse and visualise terabytes or even petabytes of data by individual users or researchers in a user-friendly, inexpensive and resource-efficient manner.
So Why R?
Although alternative tools exist, with Python being one example, R has the advantage of being the only open-source programming language that has been built specifically for statistical analysis. It contains its own inbuilt statistical algorithms – the sheer amount of mathematical models and machine learning algorithms available to users in base R and third-party packages is staggering and continues to grow—reaching almost 7,000 add-on libraries on the Comprehensive R Archive Network (CRAN) as of August 2015.
Beyond its analytical and machine learning capabilities, R also allows for interactive graphics through external packages, with support for Google’s visualisation API (which allows access to structured data and visualises that data using JavaScript within web pages as well as enabling the creation of gadgets) and javascript libraries such as D3.js. It provides users with the option to import data in a variety of formats and it is compatible with flexible NoSQL, a database that enables the storage and retrieval of data that is not modelled in the tabular relations used in relational databases, as well as the more traditional SQL-style relational database management systems. As for the programming language used, a user can create their own “grammar” benefiting from one of the R’s feature as an object-oriented language. Furthermore, R is extremely versatile and runs on all common operating systems. Distributions of R include the core R console for Windows, Mac or Linux and a number of graphical interfaces such as RStudio (an integrated development environment for R), RStudio Server and many other open-source or commercial licenses. The R scripting and code highlighting is even supported in Notepad++.
Being open source, R benefits from being free of charge and is available on the R project pages. There is also a great deal of support on hand, as the R community is incredibly active, sharing support and new ideas with one another.
Although big data processing may be accomplished with other tools, it is when one moves on to the data analysis that R really stands out, owing to the huge amount of built-in statistical formulae and third-party algorithms available. It allows the user to create data outputs in an almost limitless number of formats, including plots, graphs, diagrams and dashboards. Indeed, recent R developments have enabled the building of interactive data dashboards using javascript libraries such as D3.js, rCharts, Google Charts, leaflet.js, highcharts or htmlwidgets. As there is a lot of activity around R at the moment, we can expect many other innovative ideas to develop from within the R community in the very near future.
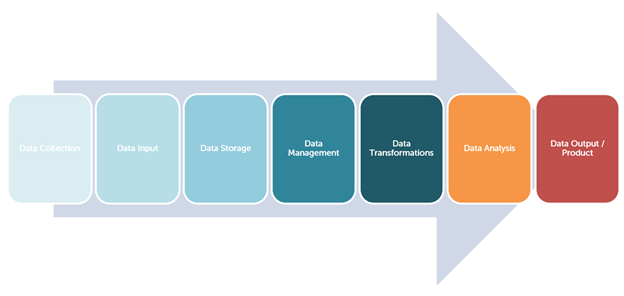
So you want to analyse big data. Where do you start?
The diagram illustrates the journey from data collection to the data output/product:
So where do you start if you want to analyse big data using R? As with any other skill, it may take some time until one gains an acceptable level of knowledge to be able to carry out statistical analyses. A good starting point is to take one of the publicly available introductory online courses on Coursera, Big Data University or DataCamp. There are also a large number of tutorial videos available on YouTube that provide you with an introductory-level guide on how to use R. The CRAN also contains a range of written documentation and manuals—it also stores the majority of publically available third-party R packages that are on offer. So this would be a great place to start your R journey.
To help guide researchers through big data processing and analysis, Szymon ran a course at the Big Data and Analytics Summer School 2015, organised by the Institute for Analytics and Data Science (University of Essex). His course “Big Data Methods in R” involved active learning methods such as case studies and real socio-economic data. It focused on four applications of the R environment and programming language to address big data problems:
- the base installation and third-party R packages which support and facilitate big data processing and analysis;
- R with databases (e.g. NoSQL databases such as MongoDB);
- RHadoop for connectivity with Hadoop architecture: HDFS and MapReduce framework;
- Cloud Computing (Microsoft Azure, Amazon Web Services) and R
During the 4-hour workshop, attendees had the opportunity to put all presented skills and technologies into practice by running R processing algorithms in the Cloud to manage, transform and analyse some examples of big data and create a simple data product. To find out more about this course visit the Summer school website.