
Louise Corti, Director of Collections Development and Producer Relations at the UK Data Service, and Chris Park, Data Scientist, report back from the course, Encounters with Big Data: An Introduction to using Big Data in the Social Sciences, held in Cape Town, South Africa from 30 January to 3 February 2017.
The course met one of the objectives of the Smarter Household Energy Data project, a joint International Centre Partnership Grant between the UK Data Service and DataFirst and funded by the Economic and Social Research Council in the UK and the National Research Foundation in South Africa, to create a collaborative research infrastructure for large-scale household energy data. Louise Corti, one of the principal investigators told us: “This course introduced part of our work on ‘scaling up’ data curation and user access approaches for big data, predominantly where larger or more complex data sources – bigger than the 5GB maximum download bundle of survey data that our users typically access – or where computationally-intensive and iterative modelling is needed.”
The course covered aspects of extraction, exploration, and statistical analysis of big data behind the UK Data Service’s new Data Services as a Platform (DSaaP) initiative being developed in partnership with Hortonworks, a leader in Hadoop-based data technologies. The new platform will be using solutions that deliver data at scale, with speed, and security, including Hive, Spark, and Zeppelin, which integrate seamlessly with popular data analysis environments like R and Python. We received applications for the course from universities across South Africa, including the University of Cape Town, University of Witwatersrand, Stellenbosch University, and the University of Pretoria, as well as from government agencies including the South African National Space Agency and the Human Sciences Research Council of South Africa. The participants were highly experienced in using cross-sectional and longitudinal survey data, public health and medical data, transport data, financial data, and satellite data.
Nathan Cunningham, Director of the Big Data Network Support directorate at the UK Data Service, summarised the training: “Our aim was to support researchers in understanding and analysing large and complex datasets, focusing on leveraging the power of popular statistical software like R within a big data environment.”
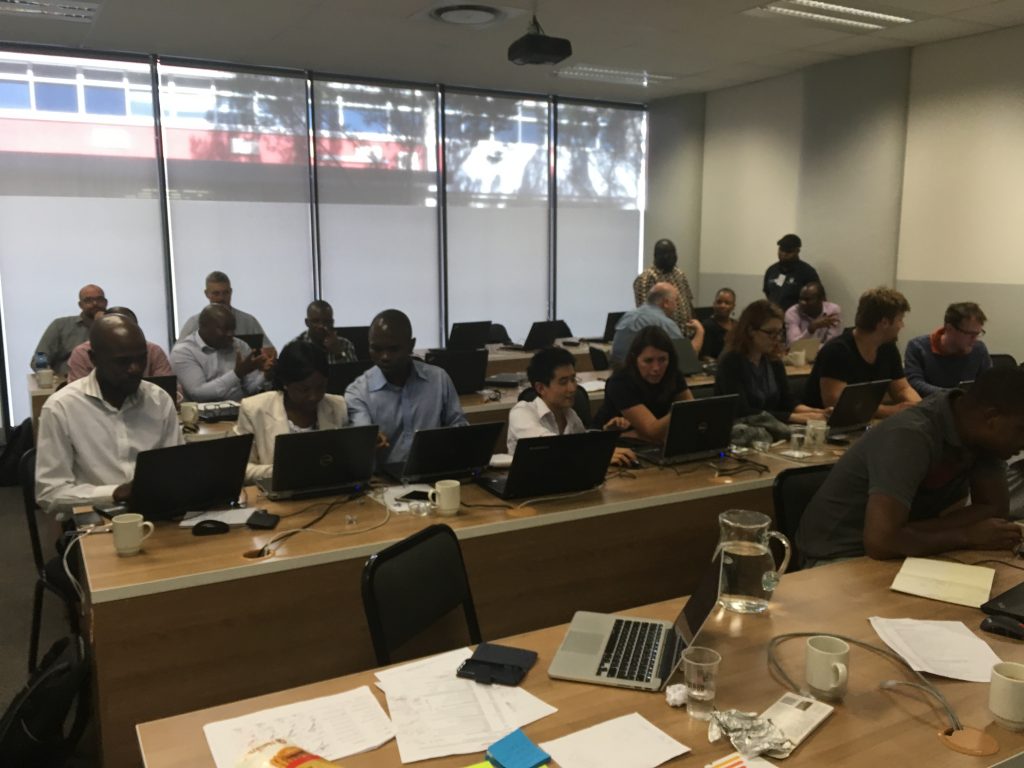
The first day offered participants an overview of how big data methods can be applied to social science, using new tools and enhanced modelling techniques. The Data Services as a Platform initiative was introduced by Darren Bell, lead Repository Architect at the UK Data Service, and Peter Smyth, Big Data Training Expert at the UK Data Service. Martin Wittenberg, Professor of Economics and Director of DataFirst at the University of Cape Town presented his work on restructuring a 20-year health and demographic surveillance study based in South Africa showing an example of big data analysis using night-time satellite data from NASA as a proxy to explore the impact of electrification on South Africa’s economic development over time, highlighting the exciting opportunities that lie ahead for using big data in the social sciences.
Louise Corti presented on how national statistics offices around the world have been exploring alternative sources of collecting data on citizens (instead of surveys and censuses), and showed an example looking at tourism data from World Heritage Sites on Wikipedia. Participants worked in groups to devise their own national statistics focused ideas for analysis including:
- Public Health: Understanding how Google searches on medical terms reflect disease prevalence and how bias in the data might be related to rural/urban access to technology, and the use of specialist terminology;
- Crime Rates: Using crime statistics to identify policy intervention by mapping crime rates over time using aggregated provincial crime stats and police station reports of crime and location;
- Transport: Studying transport policies to assess different needs for private and public transport. The team used Google tracking location for traffic showing how different categories of commuters are likely to experience different commuting times and local weather station pollution data as a proxy for congestion and emissions.
- Monetary policy: Following the recent currency changes in Zimbabwe, the team assessed preparedness for new currency using google location and sentiment analysis of social media data from Twitter and Facebook to see what people are talking about.
Libby Bishop, Manager for Producer Relations and Research Ethics at the UK Data Service, followed with a talk on the role of legal and ethical concerns when using big data. She cited examples of conditions under which research using Twitter data can be shared, and the likelihood of increasing the risk of re-identification given the proliferation of public multiple data sources available about people. Libby showed the UK Data Service is keen to promote the idea that disclosure risk is best viewed as a continuum rather than a dichotomous concept. She also suggested that the 5 Safes Framework, which is being actively used and promoted by the Service, is an excellent approach for controlling access to disclosure data, and a means by which rich policy-relevant analysis could be safely undertaken.
Over the next two days, Peter Smyth and Chris Park delivered presentations and led group exercises focused on manipulating data using tools supporting the DSaaP. Peter Smyth demonstrated how to create and query tables in Hive, and introduced Zeppelin notebooks as a means of carrying out interactive data analysis within a big data environment. Chris Park described ways of scaling out small-scale analyses implemented in R with SparkR, and introduced students to aspects of distributed computing and how and when it could benefit research. Practical exercises, such as fitting linear models to large-scale open data were used to put the theory and concepts into practice. Aspects of provisioning and monitoring Hadoop clusters using Ambari and data visualization using the leaflet library were also discussed.
Before participants moved onto formulating group projects, a concluding talk summarised the UK Data Service data processing pipeline. Over the course of the remaining two days, the groups worked on projects focused on accessing structured data from the web, then importing, querying and linking them for exploratory data analysis, modelling, and mapping. The group projects were very interesting and explored unfamiliar open source data sources and software packages. We ended the course by awarding a prize to ‘Team Synergy’, a group of demographic and health data managers and economists, who undertook a comprehensive spatial analysis of mortality in South Africa using Zeppelin, Hive, and SparkR.
Congratulations to Team Synergy on winning the project prize with Mortality statistics in South Africa. @UKDataService #ZABigData17 pic.twitter.com/t04pGvSau9
— Louise Corti (@LouiseCorti) February 3, 2017
We received some great feedback:
”Great introduction to whole field, gentle ease in to more technical concepts”
“Knowing what the other participants are working on is very helpful – a round robin type introduction saves a great deal of time during networking breaks as you can gravitate quickly towards those you want to follow up with. Really enjoyed the exercises – learning happens in action!”
“The practicals on how to navigate Hive were interesting and mind opening”
“I could easily follow the hdfs command lines and the effectiveness of Hadoop and think this software is going to be useful to my studies”
“Really enjoyed the R and Spark sessions. Felt like this is what I’ll be most able to work on in my future research (economics). The exercises were very useful –because the content was accessible and also because of the way that the code was templated for us to follow along with Introductory lectures appreciated – was easy enough to follow. Chris’s anecdotes very welcome (thanks!)”
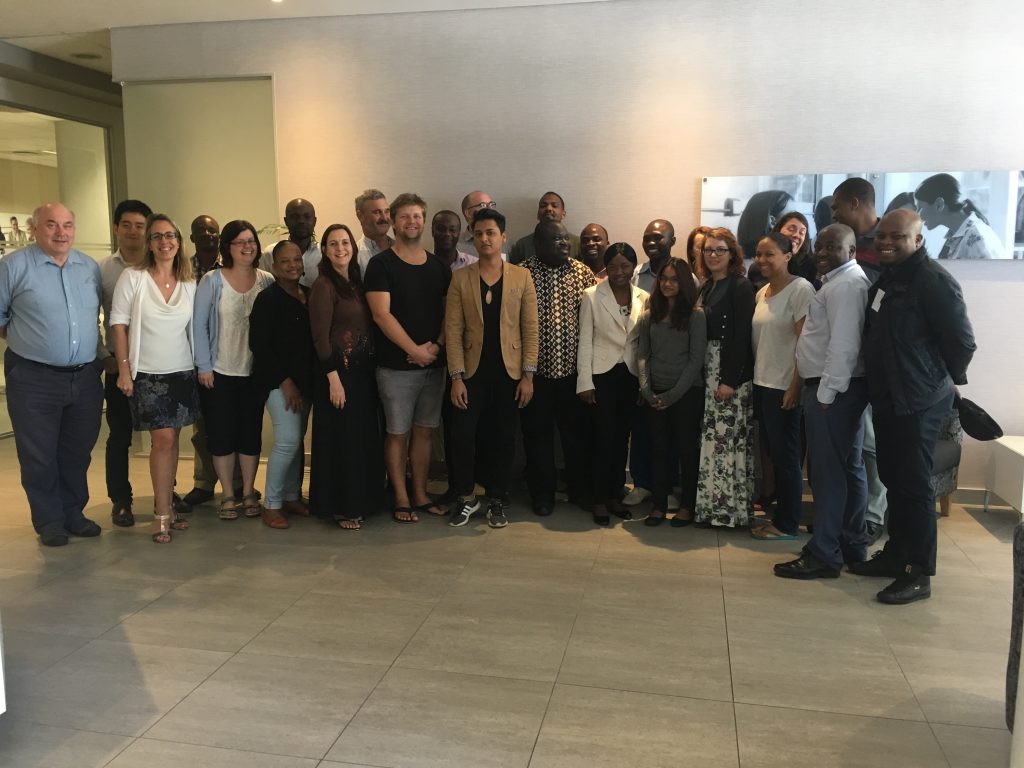
A great end to our 5 day intensive course in Cape Town. Wonderful hospitality and enthusiasm for learning @UKDataService #ZABigData17 pic.twitter.com/KOdK1jjxXT
— Louise Corti (@LouiseCorti) February 4, 2017