
Bram Vanhoutte @bvhoutte, UK Data Service Data Impact Fellow and Research Fellow in Sociology at The University of Manchester, shares his journey about how data can be a powerful tool in illustrating and addressing social inequalities.
My first independent engagement with quantitative data was my master dissertation in Sociology, and consisted of a comparative investigation of political distrust and its determinants in the low countries (in Dutch https://www.ethesis.net/politiek_wantrouwen/politiek_wantrouwen.htm) using the European Social Survey (ESS).
When I look back at that analysis, and compare it with today, two things stand out:
First, the topic itself, as well as the type of data I used to investigate it have gained importance rather than lost relevance over more than 10 years. Distrust in politics is one of the drivers of recent political earthquakes such as the Brexit referendum outcome and last US election. Generally, anti-immigrant sentiment still accompanies political distrust, illustrating a scapegoat mechanism that works both up and downwards. I’m currently engaging again with this topic, as a PhD supervisor. Accessible multi-national survey data, such as the ESS, remain a key instrument for social scientists, creating a level playing field for researchers from different institutions, countries and disciplinary backgrounds.
Second, my analytical skills, as well as general infrastructure in terms of analytical possibilities have expanded exponentially. Since that first multivariate regression, I have learned how to use multilevel and growth models to investigate spatial and temporal variations, made use of latent classes spatial lags, as well as delved into more exotic subjects such as social networks and sequence analysis. In terms of infrastructure, I have migrated to software such as Stata and Mplus, and want to embark on a steep learning curve into R. Statistical analysis software has become much faster, datasets much larger, and access more open. This all underwrites an explosion of possibilities to do analysis, so that it becomes more and more important to find out which questions really matter to you as a researcher, and society at large.
Crucial data skills specific to sociology in my opinion can be narrowed down to conceptual and heterogeneity issues:
In contrast to qualitative scholars, quantitative social scientists often conduct secondary analysis: they try to answer questions for which the questionnaire was not originally developed. This means it is not always straightforward to conceptually map data onto theory. Concepts like social position, social capital and health can be measured in different ways, and this affects how strong relationships examined will be. How well different pieces of information fit together can be examined both theoretically and statistically, making use of (confirmatory) factor analysis, a technique I have been teaching for a number of years in short courses at the Cathie Marsh Institute. Thinking through how we measure things in surveys as such is a key skill for a social scientist.
Population averages always attract a lot of attention, but are not always useful. Often results that illustrate differences and inequalities can be more compelling. It takes more skill, and sometimes more advanced techniques to get to this heterogeneity, but ultimately pays off by being closer to the truth. An example from a recently published paper on housing histories, is that on average, people in England over 50 have lived in an owned house for about half of the first 50 years of their life. This average hides the large variation in duration of home ownership (see fig 1 below), ranging from a large share of people who have lived in owned housing all their life, to a large group of people who have never lived in owned housing. It’s clear that the average misrepresents the actual experience of people with home ownership substantially, and that a more complex picture gives more insight into what is actually happening.
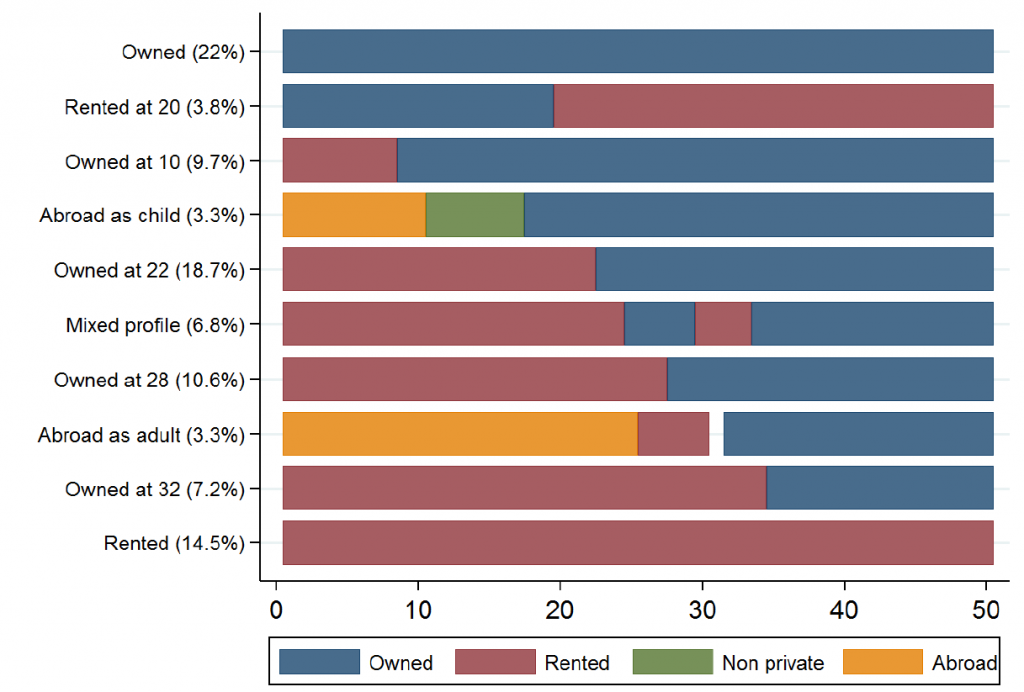
Fig 1: Duration and timing (in years) of housing profiles in England people aged 50 and over (N=7505, using The English Study of Ageing) (Source: Vanhoutte, Wahrendorf & Nazroo 2017).
Data impact
As this last example shows, data can be a powerful tool in illustrating and addressing social inequalities. It can help use our sociological imagination, to distinguish between personal troubles and societal issues, by investigating how common certain “troubles” are, and to who they happen more often. Importantly, data of good quality can help us to gain knowledge of the world that goes beyond our own experience, and help us to make inference about society. Although data are not objective in an absolutist sense, and the result of complicated mechanisms of exclusion and selection (through what the sampling frame is, the participation rate in the study, the quality of the interviewers and the type of questions asked), they can help us to check to what extent our intuitions about society hold.