In the first in an occasional series looking at the use and impact of socio-economic data from other countries which is similar to that in the UK Data Service collection, Tom Wilson and Fiona Shalley explore issues connected with calculating the number of non-heterosexual people in Australia.
How many gay, lesbian, and bisexual people live in Australia?
In a recently published paper we presented estimates of Australia’s non-heterosexual adult population in 2016. We use the term non-heterosexual to collectively refer to all those identifying as gay, lesbian, homosexual, bisexual, queer, and terms other than heterosexual or straight. Conceptually we focused on the population identifying themselves as non-heterosexual, which is not necessarily the same as the population who engage in same-sex sexual behaviour or who have ever experienced same-sex sexual attraction.
There are no official estimates of Australia’s non-heterosexual population.
In order to create some estimates we drew upon the results of three representative national sample surveys (the Household Income and Labour Dynamics in Australia survey, the second Australian Study of Health and Relationships, and the ABS General Social Survey – more information here) which asked about sexual identity, together with 2016 Census counts of the number of same-sex couples.
We estimated that the non-heterosexual population aged 18 years and above was about 592,000, or 3.2% of the Australian adult population, though there were notable variations in prevalence by sex and age group, and across the eight states and territories of Australia. This percentage is in the same ballpark as similar figures for the US, UK and Canada.
There was higher prevalence at younger ages (4.0% of males and 6.4% of females aged 18-24) and lower percentages in the 65+ age group (2.3% of males and 1.1% of females.
Differences were evident across Australia’s jurisdictions, with the Australian Capital Territory having the highest non-heterosexual population (comprising 5.1% of the resident population) and, jointly Western Australia, South Australia, and the Northern Territory with the lowest ( at 2.6%).
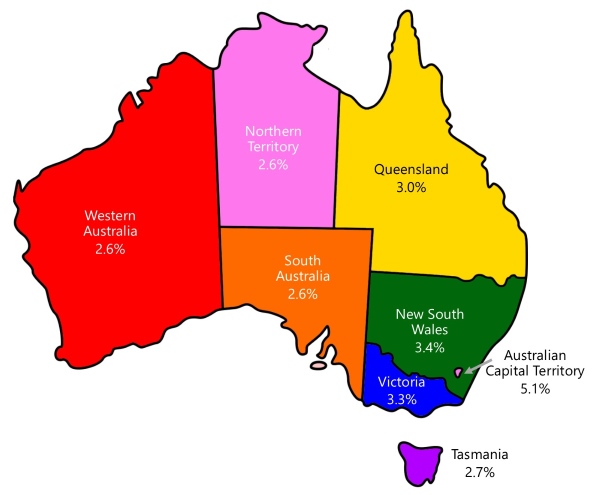
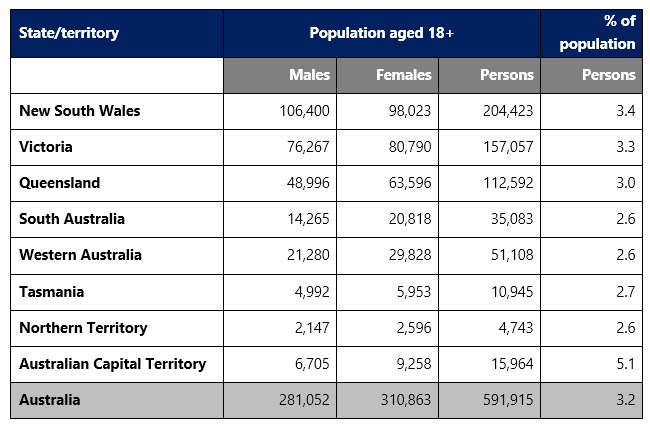
Estimates of the adult population identifying as non-heterosexual by state/territory, 2016
Source: Wilson and Shalley (2018)
There are several ways in which we believe these population estimates, and similar statistics on the demography of sexual minorities, are useful.
In 2017, after many years of debate, the issue of whether the law in Australian should be changed to allow same-sex couples to marry was put to the electorate. The public voted in favour and the law was changed in late 2017. But the debate in the lead up to the vote included the airing of considerable misinformation and unpleasantness. And, even after the legalisation of same-sex marriage, there are many aspects of life where discrimination and prejudice related to sexual orientation remain.
Carefully prepared statistics on the demography of non-heterosexual populations increase knowledge and understanding of this part of society, thereby helping to combat misinformation and myths. And as efforts to tackle discrimination are increasingly being enshrined in law, better demographic evidence can highlight where strategies are needed to eliminate disadvantage and discrimination.
Population estimates also play an important role as denominators for a range of health, wellbeing and socio-economic indicators.
It is known that sexual minorities, especially bisexual and transgender individuals, are at greater than average risk of mental health issues and poor outcomes associated with those issues.
Population estimates can be used to calculate and monitor the incidence of specific health conditions understand differences in crime victimisation and feelings of safety, and to better explore the experience and influence of homelessness. In the ABS General Social Survey of 2014 these examples were shown to have greater negative impact on the non-heterosexual population when compared to the heterosexual population.
Estimates can also prove useful in planning for and assessing the demand for a variety of goods and services, ranging from inclusive health services, retail outlets, and holidays to same-sex weddings and retirement accommodation. In the near future, as larger generations of openly gay, lesbian and other sexual minorities reach older ages, suitably tailored retirement accommodation and aged care may be required.
The demography of sexual minorities can also contribute to broader analyses of social trends and theory.
For example, comparing the experiences of opposite-sex and same-sex couples has provided insights into gender relations. There may well be economic aspects too. Richard Florida’s well publicised work on the creative class suggests that cities and regions which prosper tend to be those that are more open and tolerant and have above average proportions of sexual minorities.
In general terms, learning about the demography of sexual minorities should contribute to the wider body of research on understanding and valuing the diversity of population groups that make up contemporary society.
About the authors
Tom Wilson is a Principal Research Fellow in the Northern Institute at Charles Darwin University. His research includes demographic projections, subnational demographic change, household change, migration estimation and analysis, indirect estimation, very elderly population trends, Indigenous demography, and LGBT demography.
Fiona Shalley is a data scientist and Research Fellow in the Northern Institute at Charles Darwin University. Her research interests include the demography of socially constructed population groups, and the use and communication of population data.
Notes on the datasets used
Tom and Fiona used the Household Income and Labour Dynamics in Australia (HILDA) survey, the second Australian Study of Health and Relationships (ASHR2), and the ABS General Social Survey (GSS), as well as figures from the 2016 Australian Census.
The Australian Census is conducted every five years, unlike the UK census which is conducted every ten years.
HILDA has similarities to the British Household Panel Survey and Understanding Society.
ASHR2 has similarities to the National Survey of Sexual Attitudes and Lifestyles.
The GSS is conducted by the Australian Bureau of statistics every four years and covers a range of topics including:
- demographic characteristics
- housing and mobility
- education (includes parental education)
- employment
- transport and mobility
- subjective well-being and general life satisfaction measures
- health and disability
- difficulty accessing service providers
- family and community involvement
- social networks and participation
- experiences of homelessness
- voluntary work
- crime and feelings of safety
- sports attendance and participation
- attendance at selected cultural and leisure venues
- information technology
- financial stress, resilience and exclusion
- income
- housing
- assets and liabilities
- discrimination
- visa status
- sexual orientation