
 In the first of two blog posts, Dave Rawnsley and Chris Daly explore usage of the UK Data Service’s international and census data, and how data citation can demonstrate how far data-enhanced research reaches.
Some background
A few years ago, we embarked on a journey to discover what people have done with the data we provide and why it is important that we do what we do. The results of this work informed our decision making processes for the following years.
We’ve taken some time to revisit that work, bringing it up to date and discovering what interesting, exciting and useful fruits have been borne from our work in the intervening years. Our team have kept statistics on which data and web pages have been visited and downloaded for many years now, using Google Analytics and Google Data Studio.
Each year we update our Popularity Rankings spreadsheet to see how individual datasets are being used and how they compare to previous years. This informs our decisions on the priority with which datasets get uploaded, how often and which areas need more promotion.
Over the period January to September 2020 we recorded 22,608 data access sessions, 27,394 data downloads and 87,467 page views on the UK Data Service’s international data dissemination platform. InFuse, Casweb, GeoConvert and DKAN saw 25,596 sessions from over 7000 users.
The sessions are unique pageviews – aggregated dataset pageviews that are generated by the same user during the same session, while the downloads are export pageviews – the number of times a user clicks on export to download a dataset. The sessions are unique pageviews – aggregated dataset pageviews that are generated by the same user during the same session, while the downloads are export pageviews – the number of times a user clicks on export to download a dataset.

Figure 1: Top 25 downloaded datasets from our international data dissemination platform
If we compare these popularity rankings with those from Jan-Sept 2016 we can see that the World Development Indicators have moved up a place and significantly increased their usage.
The other big movers have been International Energy Agency datasets: previously there were none in the top ten, now there are three. This reflects the greater interest there is in energy and climate research, for instance the unique research collaboration involved in the Lancet Countdown, as well as extra work the UK Data Service team have put into releasing the data quickly and in promoting its use.
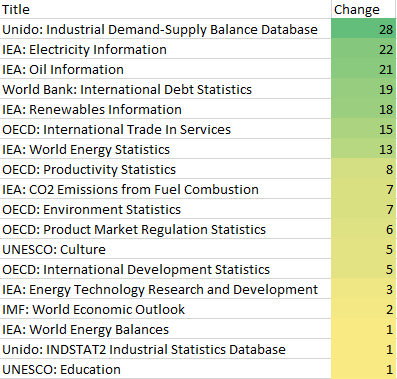
Figure 2: Positive positional change in popularity of datasets (view data in new tab)
It’s possible that the Covid-19 lockdown affected dataset views and downloads for a while, even though many were still able to work and study from home. There were 11,131 downloads from our international data platform from March to September 2020 compared to 13,397 downloads for the comparable time in 2019. Encouragingly, figures for October 2020 were almost identical to those of October 2019, so it seems likely that this was just a temporary reduction.
What’s next?
In our next blog post, we will dig deeper into citing data and how it helps us gain a better understanding of how and where the data is being used, the impact it is having and the stories it is telling.
Other resources
- Open Data at the UK Data Service – https://www.ukdataservice.ac.uk/get-data/open-data/international-macrodata
- Publications on Google Scholar citing international data from UK Data Service.
- Usage statistics for our international data dissemination platform
- Case studies demonstrating data use and its impact
About the authors
Dave Rawnsley and Chris Daly are Senior Technical Officers in the UK Data Service aggregate data team based at Jisc.