 What is the difference between poverty and deprivation? How can they be measured and understood? How can data help policymakers find ways to reduce their effect on the lives of people in the UK, especially given the effects of the Covid-19 pandemic? In this post, Neil Dymond-Green examines measures for deprivation. In his next post, Neil investigates how poverty can be measured.
Measuring deprivation
Indices of Deprivation
In the UK, figures on deprivation have been calculated for England by the Ministry of Housing, Communities and Local Government (and its predecessors) since the 1970s. A key part of the indices is the Index of Multiple Deprivation (IMD) which defines deprivation in terms of a range of living conditions or domains of deprivation, namely:
- Income
- Employment
- Health deprivation and disability
- Education, skills and training
- Crime
- Barriers to housing and services
- Living environment
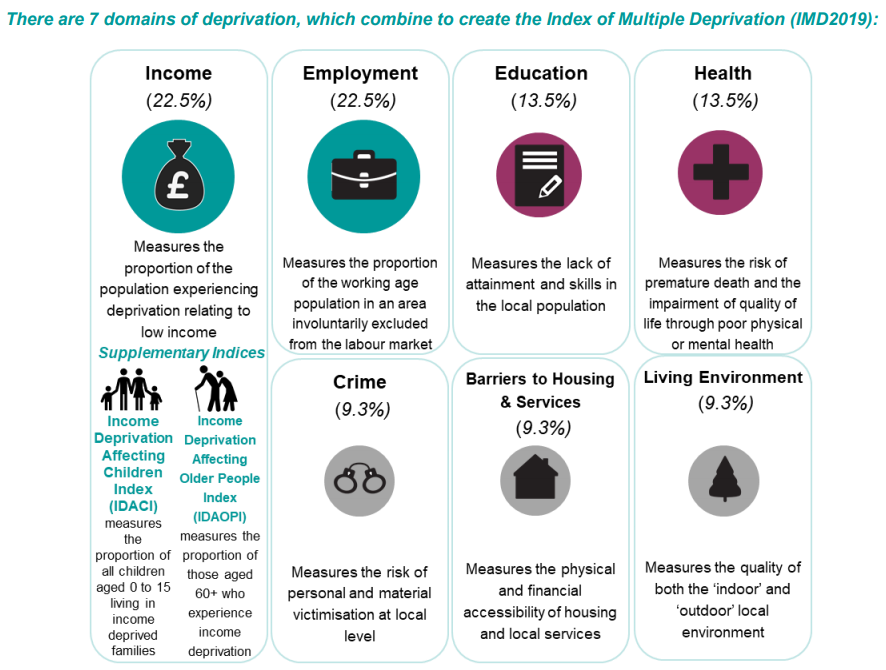
Image: the seven different domains, their weightings and supplementary indices (HM Government)
The IMD is a measure of deprivation, which the government defines separately to poverty. As stated in the September 2019 Statistical Release of the English Indices of Deprivation:
People may be considered to be living in poverty if they lack the financial resources to meet their needs, whereas people can be regarded as deprived if they lack any kind of resources, not just income.
The Indices of English Deprivation are based on 39 indicators, organised across the seven domains of deprivation. They are then weighted to calculate the IMD down to the level of Lower-layer Super Output Area (LSOA), roughly speaking a neighbourhood of 1000-3000 people. All LSOAs across the country are then ranked by their level of level of deprivation relative to other areas.
The majority of the data used to calculate the Indices of English Deprivation/IMD are administrative data, although a small amount of census data is used where gaps in the administrative data are identified.
It’s important to note that there is no absolute level of measurement, only a relative one. The example the 2019 Statistical Release gives is that:
The Indices of Deprivation measure deprivation on a relative rather than an absolute scale, so a neighbourhood ranked 100th is more deprived then a neighbourhood ranked 200th, but this does not mean it is twice as deprived.
Indices or Measures of Multiple Deprivation are also calculated for Wales, Scotland and Northern Ireland, however there is no UK-wide measure.
As an indicator, the IMD/Indices of Deprivation are not able to provide information specifically about lack of financial resources and also give no absolute measures. In addition, the way they have been calculated over time means each version is not comparable.
A limitation of the Indices of Deprivation/IMD is that when report on at local authority level, they can mask large differences.
For instance, according to the 2019 IMD scores, Kensington and Chelsea as an authority was ranked 122 out of 317 local authorities in England (with 1 being most deprived) and yet it has 23 LSOAs which are within the 20% most deprived in England (including 9 LSOAs which are within the 10% most deprived).
The Ministry of Housing, Communities and Local Government has produced a dashboard of the Indices of Deprivation/IMD. The UK Data Service also holds IMD data (in the Information about postcodes section).
Townsend Deprivation Scores
In 1988, Professor Peter Townsend introduced an approach to measuring deprivation within a population. The measure is based on four variables:
- Unemployment (as a percentage of those aged 16 and over who are economically active);
- Non-car ownership (as a percentage of all households)
- Non-home ownership (as a percentage of all households) and
- Household overcrowding.
Townsend scores were originally calculated using 1981 census data to the level of output areas (100-625 people), which allows for finer detail in assessing deprivation within areas than the IMD/Indices of Deprivation.
Interns Sanah and Amy joined our team a few summers ago through the University of Manchester’s Q-Step programme to calculate the Townsend scores based on 2011 Census data. Their findings make interesting reading.
As with the IMD/Indices of Deprivation, the Townsend scores can only produce relative measures of deprivation. They can, in a similar way, be used to ‘rank’ areas. Townsend scores have been used by UK health authorities in assessing levels of deprivation and assigning resources, as the scores show a high level of correlation with measures of ill health.
Carstairs Deprivation Index
The Carstairs derivation index was originally calculated using 1981 census data and is another measure of relative deprivation. Like the Townsend score, it is based on four variables which represent material disadvantage. Similarly, it is calculated at the output area level.
The four variables are:
- Male unemployment (as a percentage of economically active males aged 16 to 74 seeking or waiting to start work)
- Overcrowded households (as a percentage of all households)
- Non-ownership of car or van (as a percentage of all households)
- Low social class (social class IV Partly skilled occupations and V Unskilled occupations)
Social Class based on Occupation has since been superseded by the National Statistics Socio-economic Classification (NS-SEC).
As with the IMD/Indices of Deprivation and the Townsend scores, the Carstairs index can only demonstrate relative measures of deprivation.
Q-step interns Rabia and Clara who joined our team in summer 2018 documented some of their process in recalculating the Carstairs scores using 2011 Census data.
Jarman score
The Jarman score was developed in the 1980s primarily as a measure of General Practice workload (and as part of the calculation of deprivation payments to GPs). The Jarman score combined responses from GPs about their workload with eight census variables:
- % elderly living alone
- % children under 5
- % unskilled workers
- % overcrowded households
- % changed address in last year
- % residents living in a household where the head was born in the New Commonwealth or Pakistan
- % unemployed
- % households containing lone parents
The greater the positive score, the more deprived – and in need of primary medical care – the resident population of a ward were. The Jarman score has not been recalculated since the 2001 Census.
The score was not originally intended to be used to measure deprivation, but became, over time, a proxy score in some cases.
Limitations of deprivation measures
It can be argued that there is a weakness in the Townsend and Carstairs approaches around the inclusion of non-car ownership.
In heavily urbanised areas with good public transport provision (and often poor provisioning for affordable parking), especially most parts of London, many people consciously choose not to own a car irrespective of economic background. Conversely, in rural areas and those with limited public transport options, access to a car is more or less essential – people with limited means may have to sacrifice other expenditure to allow for purchase and running of a motor vehicle.
While Townsend and Carstairs scores have always been calculated in the same way, societal changes may mean that there are issues of comparability over time.
For example, the nature of home ownership has changed considerably since the 1980s as has car ownership. Likewise, in the Carstairs measure, concepts around social class have inevitably changed over time through social mobility and changes within work, such as the decrease in manufacturing jobs in the UK over the past forty years.
Inevitably also, in a relative system such as those discussed, a change in deprivation level relative to another area cannot be used reliably to demonstrate a whether an area has ‘improved’ or ‘declined’ in an absolute manner and caution must be exercised when examining deprivation scores over time.
As already noted, deprivation scores (by their nature) cannot give an absolute measure of poverty or deprivation, only an indicator of how deprived an area is in relation to others.
Given the limitations of measuring deprivation, in our next post we will turn our attention to measuring poverty, a developing field.
About the author
Neil Dymond-Green has been the Impact Manager for the UK Data Service since 2018 and is currently seconded to the role of Service Director for Data Impact.
Neil,
I only joined UK data service at the start of this month in order to access the data related to the studies by Professors Gazely and Newell of University of Sussex and Professor Scott and Dr. Walker of Henley Business School (University of Reading).
I have used “lockdown” to research the social and economic history of the UK (GB/England etc.) from 1700. I have chosen to cut-off before the Coronavirus debacle as that is clearly “work-in-progress” in the economy and people’s livelihood.
Your article is very apposite for one of my chapters, and the UK Data Service has yielded the most amazing data.
I will be very interested in your next article as I am also researching particular the view of Peter Townsend and Tony Atkinson in all of this.
I am forming a view of my own about this very matter, though do not yet have any sort of answer to the nub of the question about these two “imposters”, namely how we measure them, but I am far from convinced that relative “poverty” is poverty at all, but is really “dis-advantage” or “deprivation” in the strict senses of the word, not “poverty”.
I have just cracked some key data up to 2017/18 so can now make good statements about the period from 1700 to-date from multiple angles, I believe.
Next is to start writing the book.
Jackie
Thanks for your comment, Jackie.
It would be interesting to see how your perspectives and findings develop as your conduct your research. Do please feel free to get in touch as your work progresses.